The graph below shows the consumption of fish and some different kinds of meat in a European country between 1979 and 2004. Fish and Meat consumption
Same question Compare 6 different answers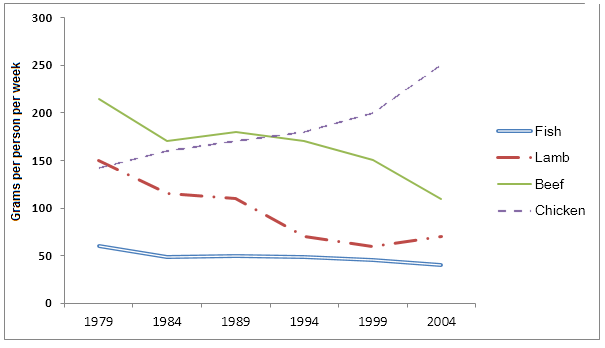
Sample Response
The line graph gives information on weekly fish and meat consumption per person in a European country between 1979 and 2004.
In 1979, the most eaten kind of meat was beef and the least one was fish. People in this country ate roughly 225 gm beef per week while such people consumed only 60 gm fish in a week. Beef consumption fluctuated between 1979 and 1984, levelled in nest 5 years and decreased dramatically from 225 gm to 100 gm per week 1989 to 2004. Fish consumption also had been declining from 60 gm to 45 gm in 25 year period.
The other outstanding trends in the consumption of kinds of meat indicated in the graph are chicken and lamb. They had converse directions. In 1979, the weight of consumed chicken by an individual was 140 grammes per week which had been increased significantly to 250 gm per week in 2004. By contrast, people in such European country had diminished drastically their lamb consumption from 150 gm to 60 gm per week in 25 year period.
IELTS Writing Correction
- 1. Use precise phrasing Original: most eaten kind of meat Suggested revision: most widely consumed meat Why it matters: This is the more natural expression for the largest amount consumed.
- 2. Name the category Original: the least one Suggested revision: the least consumed item Why it matters: This identifies the comparison more precisely than the vague pronoun.
- 3. Correct starting value Original: 225 gm beef Suggested revision: about 210 grams of beef Why it matters: The graph places beef consumption at roughly 210 grams per person per week in 1979.
- 4. Avoid awkward reference Original: such people Suggested revision: they Why it matters: The pronoun refers clearly and naturally to people in the country.
- 5. Add missing preposition Original: 60 gm fish Suggested revision: 60 grams of fish Why it matters: A measured quantity needs of before the food noun.
- 6. Describe the fall Original: fluctuated Suggested revision: fell Why it matters: The plotted beef figure drops from about 210 to 170 grams over these two data points.
- 7. Correct trend wording Original: levelled in nest 5 years Suggested revision: rose slightly over the next five years Why it matters: The beef line rises from about 170 to 180 grams between 1984 and 1989.
- 8. Correct beef figures Original: decreased dramatically from 225 gm to 100 gm Suggested revision: then fell from about 180 grams to about 110 grams Why it matters: The graph shows these approximate values for beef in 1989 and 2004.
- 9. Add time preposition Original: per week 1989 to 2004 Suggested revision: per week from 1989 to 2004 Why it matters: From is required to introduce the beginning of the stated time range.
- 10. Use simple past Original: also had been declining Suggested revision: also declined Why it matters: The simple past is appropriate for a completed trend over a finished period.
- 11. Fix time phrase Original: 45 gm in 25 year period Suggested revision: about 40 grams over the 25-year period Why it matters: This corrects both the compound adjective and the graph's 2004 fish value.
- 12. Use neutral wording Original: outstanding Suggested revision: notable Why it matters: Notable is a more appropriate academic description of visible trends.
Suggested Rewrites
- most eaten kind of meat most widely consumed meat
- the least one the least consumed item
- 225 gm beef about 210 grams of beef
- such people they
- 60 gm fish 60 grams of fish
- fluctuated fell
Why this response received Band 6.0
The response covers all four series and generally communicates the major upward and downward trends, with clear paragraphing by data group. Its main limitation is the lack of a distinct overview and several imprecise figures and trend descriptions, especially for beef, chicken, and lamb. Prioritise a concise overview comparing the dominant changes and verify each key value against the graph before reporting it.
IELTS Writing Criteria Scores
Task Achievement
All four categories and their broad directions are covered, but there is no distinct overview and several values or trend details are imprecise.
Add a clear overview highlighting chicken's rise above beef and check endpoint figures carefully against the graph.
Coherence and Cohesion
The response progresses logically from beef and fish to chicken and lamb, though some referencing and transitions are awkward.
Use clearer comparative links and direct nouns instead of vague references such as “such people” and “They”.
Lexical Resource
There is sufficient topic vocabulary for describing trends, but several collocations and word choices are unnatural or inaccurate.
Prefer precise forms such as “beef consumption,” “over the next five years,” and “fell” rather than strained expressions.
Grammatical Range and Accuracy
A mix of sentence forms conveys the meaning, but recurring article, preposition, tense, and passive-form errors reduce control.
Use simple past consistently for completed historical trends and check articles and prepositions in every data sentence.
Write this task while it is fresh
Try the same task now. It helps you remember the feedback and write better next time.
IELTS Academic Writing Task 1
The graph below shows the consumption of fish and some different kinds of meat in a European country between 1979 and 2004. Fish and Meat consumption
Your response
Write the task yourself, then compare your choices with the annotated response.