The graph below shows the consumption of fish and some different kinds of meat in a European country between 1979 and 2004. Fish and Meat consumption
Same question Compare 6 different answers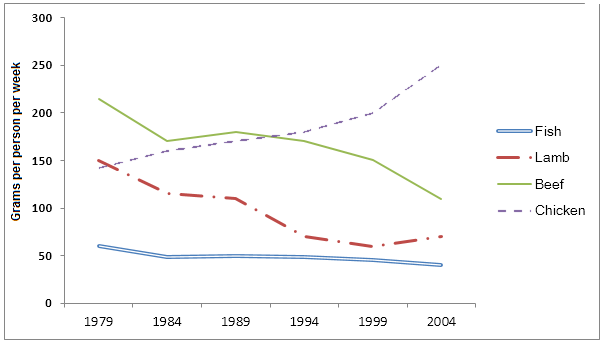
Sample Response
The line graph compares weekly consumption of four different eatables (i.e. beef, chicken, lamb and fish) in a European country from 1979 to 2004. Overall, it can be seen from the line graph that the consumption of meat and fish decreased during the period of 25 years with the exception of chicken. It can be seen from the graph that in 1979, the consumption of beef was the highest at around 220 grams per person per week. After that, however, the consumption decreased gradually to nearly 170 grams in 1984 and rose again marginally in 1984, before falling dramatically to just above 100 grams in 2004. Similarly, lamb’s consumption decreased slightly over the period of 25 years, decreasing from 150 grams to approximately 70 grams by 2004. By contrast, the consumption of chicken, which was 150 grams in 1979, increased steadily till 1999, after which it rose significantly and reached a peak of 250 grams by 2004. But, fish remained unpopular throughout the period with a little decline of 10 grams from just over 60 gram per person intake. gmail.com ]
IELTS Writing Correction
- 1. Use precise category Original: eatables Suggested revision: foods Why it matters: “Foods” is more natural and appropriately formal in this context.
- 2. Correct rebound year Original: rose again marginally in 1984 Suggested revision: rose again marginally by 1989 Why it matters: The beef line rebounds after 1984 and reaches its next value in 1989.
- 3. Use natural noun phrase Original: lamb’s Suggested revision: lamb Why it matters: The attributive noun “lamb” is more natural than the possessive form here.
- 4. Reflect change size Original: slightly Suggested revision: substantially Why it matters: Lamb consumption falls by more than half, from about 150 to 70 grams.
- 5. Fix transition Original: But Suggested revision: Meanwhile Why it matters: “Meanwhile” introduces the contrasting fish trend without the incorrect comma after “But.”
- 6. Use objective wording Original: remained unpopular Suggested revision: had the lowest consumption Why it matters: Task 1 should report the measured ranking rather than infer popularity.
- 7. Use formal trend phrase Original: little Suggested revision: slight Why it matters: “A slight decline” is the conventional formal expression for a small decrease.
- 8. Use plural unit Original: gram Suggested revision: grams Why it matters: A quantity greater than one requires the plural unit “grams.”
- 9. State full unit Original: per person intake Suggested revision: per person per week Why it matters: The graph reports weekly consumption per person, so the time unit must be included.
- 10. Delete stray text Original: gmail.com ] Suggested revision: Delete Why it matters: This unrelated source fragment should not appear in the report.
- 11. Use concise duration Original: during the period of 25 years Suggested revision: during the 25-year period Why it matters: The hyphenated compound adjective expresses the duration more concisely.
- 12. Tighten exception phrase Original: with the exception of chicken Suggested revision: except for chicken Why it matters: This shorter phrase states the sole exception clearly.
Suggested Rewrites
- eatables foods
- rose again marginally in 1984 rose again marginally by 1989
- lamb’s lamb
- slightly substantially
- But Meanwhile
- remained unpopular had the lowest consumption
Why this response received Band 7.0
The response is strongest in its clear overview and comprehensive coverage of all four food categories, using varied language to describe change. Its main limitation is occasional imprecision in the data and trend descriptions, including the repeated 1984 reference and understated falls for lamb and fish, while the single-paragraph format weakens presentation. The highest priority is to verify each key figure and divide the overview from the detailed comparisons.
IELTS Writing Criteria Scores
Task Achievement
The response provides a clear overview and covers all four series with relevant figures, but several trend descriptions and data points are imprecise.
Verify dates and magnitudes carefully, especially the beef rebound and the larger overall declines in lamb and fish.
Coherence and Cohesion
The sequence from overview to individual categories is easy to follow and cohesive devices support comparisons, but all information is compressed into one paragraph.
Separate the introduction and overview from two grouped detail paragraphs so the main comparisons are more clearly signposted.
Lexical Resource
A good range of trend vocabulary is used with generally effective precision, despite a few awkward choices such as eatables and per person intake.
Use standard Task 1 terms such as food categories, consumption, and grams per person per week consistently.
Grammatical Range and Accuracy
Varied complex structures are mostly well controlled, with only occasional awkward phrasing, punctuation, and noun-phrase errors.
Refine the final fish sentence and check punctuation around linking words so that the remaining errors are consistently minor.
Write this task while it is fresh
Try the same task now. It helps you remember the feedback and write better next time.
IELTS Academic Writing Task 1
The graph below shows the consumption of fish and some different kinds of meat in a European country between 1979 and 2004. Fish and Meat consumption
Your response
Write the task yourself, then compare your choices with the annotated response.