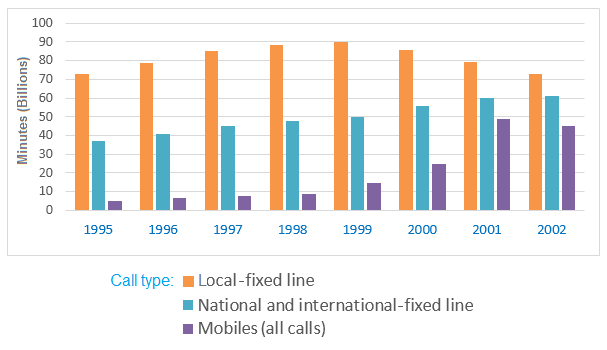
The chart below shows the total number of minutes (in billions) of telephone calls in the UK, divided into three categories, from 1995-2002.
5 bài chấm
Band
- Band 7.0Xem bài chấm chi tiết →
- Task Achievement
- Band 8.0
- Coherence and Cohesion
- Band 7.0
- Lexical Resource
- Band 6.5
- Grammatical Range and Accuracy
- Band 6.5
The bar chart outlines the duration of phone calls by the UK residents from 1995 to 2002. Generally speaking, most of the UK citizens made local calls during the period and the usage of cell phones rapidly increased.
- Band 7.0Xem bài chấm chi tiết →
- Task Achievement
- Band 8.0
- Coherence and Cohesion
- Band 6.0
- Lexical Resource
- Band 6.5
- Grammatical Range and Accuracy
- Band 6.5
A glance at the bar graph reveals how many minutes (in billions) of telephone conversations were made in Britain in eight years, 1995 to 2002. Overall, the local fixed-line calls were the most popular type from 1995 to 2002 but the increasing use of cell phone in later years was noticeable.