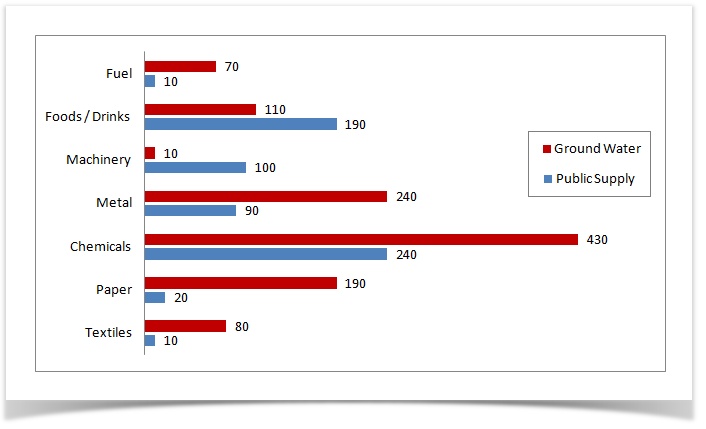
The graph below shows usual water usage (in millions of cubic meters) by industries in some countries in a year.
Sample Response
The provided graph describes the yearly water consumption from ground water and public supply by 7 manufacturers in some country. The unit is measured in millions of cubic meters.
Overall, the ground water usage is far more than public supply in most industries. Both of water supplies are mostly used in the chemical industry while the least consumption could be observed in textile and fuel industries.
Looking at the detail, the chemical manufacturing requires 430 million m3 of ground water which is approximately twice than the water consumption in metal and paper industries. In this area, public water is also used highly, contributing 240 million m3 which is almost three times as many as metal industries’ water usage. Meanwhile, the company that uses less water is fuel and textiles and each of them only needs 10 million of public water and over 70 million for ground water.
Food and drink companies have more demand for public supply than ground water supply, gaining 190 million m3 as opposed to 110 million from ground water. It is also true for the machinery comprises that consumes 100 million cubic meters of public water supply which is 10 times higher than the quantity of ground water.
IELTS Writing Correction
- 1. Use natural source phrase Original: consumption from ground water Suggested revision: consumption of groundwater Why it matters: “Consumption of” identifies what was used, and “groundwater” is conventionally one word.
- 2. Identify chart categories Original: by 7 manufacturers Suggested revision: across seven industries Why it matters: The bars represent industry categories rather than seven individual manufacturers.
- 3. Match prompt scope Original: in some country Suggested revision: in several countries Why it matters: The task prompt refers to industries in more than one country.
- 4. Fix measurement subject Original: The unit is measured Suggested revision: The figures are given Why it matters: Figures are expressed in units; the unit itself is not measured.
- 5. Use concise terminology Original: the ground water usage Suggested revision: groundwater use Why it matters: This is the standard concise noun phrase for the source shown.
- 6. Complete comparison Original: far more than public supply Suggested revision: far greater than public-supply use Why it matters: The sentence must compare two amounts of water use rather than an amount with a supply source.
- 7. Remove incorrect preposition Original: Both of water supplies Suggested revision: Both water sources Why it matters: “Both” directly modifies the plural noun and does not take “of” here.
- 8. Use precise chart wording Original: least consumption could be observed Suggested revision: lowest combined consumption was recorded Why it matters: “Lowest combined consumption” states clearly that the two sources are being considered together.
- 9. Correct lowest industry Original: in textile and fuel industries Suggested revision: in the fuel industry Why it matters: Fuel has the lowest combined total, while textiles uses ten million cubic metres more.
- 10. Name the industry Original: In this area Suggested revision: In the chemical industry Why it matters: “Area” is an unclear reference to the industry being described.
- 11. Use quantity collocation Original: used highly Suggested revision: used in large quantities Why it matters: “Highly” does not naturally modify the amount of water used.
- 12. Describe an amount Original: contributing Suggested revision: amounting to Why it matters: The water supply does not contribute the figure; the amount totals that value.
Suggested Rewrites
- consumption from ground water consumption of groundwater
- by 7 manufacturers across seven industries
- in some country in several countries
- The unit is measured The figures are given
- the ground water usage groundwater use
- far more than public supply far greater than public-supply use
Why this response received Band 6.5
The report gives a clear overview and selects accurate, useful comparisons across all seven industries, including the major exceptions where public supply exceeds groundwater use. Its main limitation is language control: awkward industry labels, imprecise collocations, and recurring comparison and agreement errors make some otherwise correct details difficult to read smoothly. Prioritise using the chart’s exact category names and standard comparative structures.
IELTS Writing Criteria Scores
Task Achievement
The overview and selected figures accurately cover the main patterns and all industries, with only minor imprecision about the smallest groundwater values.
Preserve the chart’s exact industry labels and distinguish exact values from approximations when grouping the smallest users.
Coherence and Cohesion
The response uses a clear overview and logically grouped detail paragraphs, with comparisons progressing from dominant groundwater use to the two exceptions.
Strengthen cohesion by making each body paragraph’s grouping principle explicit in its opening sentence.
Lexical Resource
There is sufficient vocabulary for water use and comparisons, but several collocations and category descriptions are awkward or imprecise.
Use standard phrases such as ‘industry’, ‘consumed’, ‘used groundwater’, ‘received public supply’, and ‘twice as much as’.
Grammatical Range and Accuracy
A range of sentence structures communicates the data, but recurring agreement, article, plural, and comparative-form errors remain noticeable.
Check subject–verb agreement and use accurate comparison patterns such as ‘twice as much as’ and ‘ten times the amount’.
Write this task while it is fresh
Try the same task now. It helps you remember the feedback and write better next time.
IELTS Academic Writing Task 1
The graph below shows usual water usage (in millions of cubic meters) by industries in some countries in a year.
Your response
Write the task yourself, then compare your choices with the annotated response.