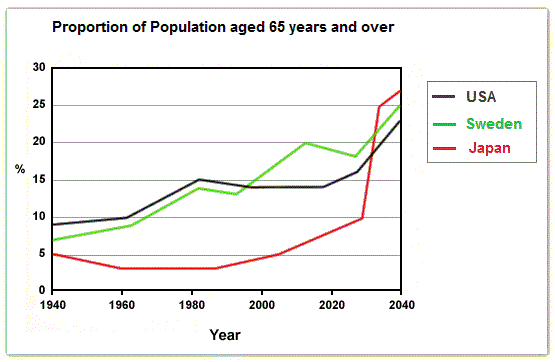
The graph below shows the proportion of the population aged 65 and over between 1940 and 2040 in three different countries.
Sample Response
The provided illustration reveals data about the percentages of people who were elderly in three countries. This research was conducted to looking further information in three different nations; they were Japan, Sweden and USA. All of the samples were aged 65 and over, whereas, the data provide a view in the long term which is 100 years.
Firstly, older population in Sweden and USA had a small difference in 1940 because they were both approximately 10% of the total population. These countries had a steady improvement for several years in terms of their number of elderly people. Meanwhile, they are predicted to have a similar result in 2040; their elder generation will rise around 25% in that year.
Secondly, Japan was position as the lowest ranked nation in 1940 which had less old people than the other two countries. Over the year, Japan will have the largest proportion of elder people in the future. According to the given figures, Japan will notice an increase in 2020 to 2040 in terms of their elder generation proportion. It will put Japan to have an aged population with more than 25%.
Lastly, all of the nations will have more proportion of elderly people in the coming years which indicate the enhanced life expectancy.
IELTS Writing Correction
- 1. Use precise population term Original: percentages of people who were elderly Suggested revision: proportions of people aged 65 and over Why it matters: This wording matches the population measure defined in the graph.
- 2. Add country article Original: Japan, Sweden and USA Suggested revision: Japan, Sweden and the USA Why it matters: The country name “USA” conventionally requires the definite article.
- 3. Describe change neutrally Original: steady improvement Suggested revision: general increase Why it matters: Population proportions increase rather than “improve,” and the lines are not consistently steady.
- 4. Report proportions accurately Original: in terms of their number of elderly people Suggested revision: in the proportions of older people Why it matters: The graph shows percentages of the population, not absolute numbers of people.
- 5. Use past participle Original: position Suggested revision: positioned Why it matters: The passive construction requires the past participle “positioned.”
- 6. Name the measured feature Original: lowest ranked nation Suggested revision: country with the lowest proportion Why it matters: The graph compares population proportions rather than ranking the countries generally.
- 7. Use countable quantifier Original: less old people Suggested revision: fewer older people Why it matters: Use “fewer” with countable people and “older” as the neutral descriptor.
- 8. Correct time reference Original: year Suggested revision: period Why it matters: The graph covers a century rather than a single year.
- 9. Use natural age term Original: elder Suggested revision: older Why it matters: “Older people” is the standard noun phrase for this population group.
- 10. Use appropriate trend verb Original: notice Suggested revision: experience Why it matters: A country can experience an increase, but it cannot literally notice one.
- 11. Correct range preposition Original: in Suggested revision: from Why it matters: Use “from ... to ...” to express the start and end of a time range.
- 12. Fix agreement and phrasing Original: their elder generation proportion Suggested revision: its proportion of older people Why it matters: The singular country takes “its,” and the revised noun phrase is natural English.
Suggested Rewrites
- percentages of people who were elderly proportions of people aged 65 and over
- Japan, Sweden and USA Japan, Sweden and the USA
- steady improvement general increase
- in terms of their number of elderly people in the proportions of older people
- position positioned
- lowest ranked nation country with the lowest proportion
Why this response received Band 5.5
The response identifies the overall rise in ageing populations and correctly recognises Japan’s eventual lead, while its country-based structure remains easy to follow. However, coverage is too general and sometimes inaccurate, overlooking Japan’s early decline and long stability, Sweden’s fluctuation, and the United States’ extended plateau; frequent grammatical and collocational errors also weaken precision. Prioritise selecting these defining trends and supporting them with accurate dates and figures before refining sentence control.
IELTS Writing Criteria Scores
Task Achievement
The report conveys the eventual overall rise and Japan’s leading position in 2040, but it omits or misrepresents several major intermediate trends and provides few precise figures.
Describe Japan’s fall and long low plateau, Sweden’s fluctuations, and the United States’ later plateau using accurate years and approximate percentages.
Coherence and Cohesion
The country-based paragraphs provide broadly clear progression, though mechanical sequencing and a weakly placed final overview limit cohesion.
Place a concise overview after the introduction and organise the details around meaningful trend comparisons rather than Firstly, Secondly, and Lastly.
Lexical Resource
Vocabulary is adequate for the topic, but frequent inaccurate collocations such as steady improvement, notice an increase, and more proportion reduce precision.
Build control of standard trend language, using phrases such as rose steadily, remained stable, and the proportion increased.
Grammatical Range and Accuracy
A mix of simple and complex forms communicates the main meaning, but errors in verb patterns, articles, agreement, and sentence construction occur frequently.
Practise forming accurate complex sentences, especially infinitive and participle patterns, subject–verb agreement, and comparative structures.
Write this task while it is fresh
Try the same task now. It helps you remember the feedback and write better next time.
IELTS Academic Writing Task 1
The graph below shows the proportion of the population aged 65 and over between 1940 and 2040 in three different countries.
Your response
Write the task yourself, then compare your choices with the annotated response.