剑桥雅思学术类 Writing Task 1 真题

Cambridge IELTS 16 Academic Writing Task 1 真题

Test 1Task 1

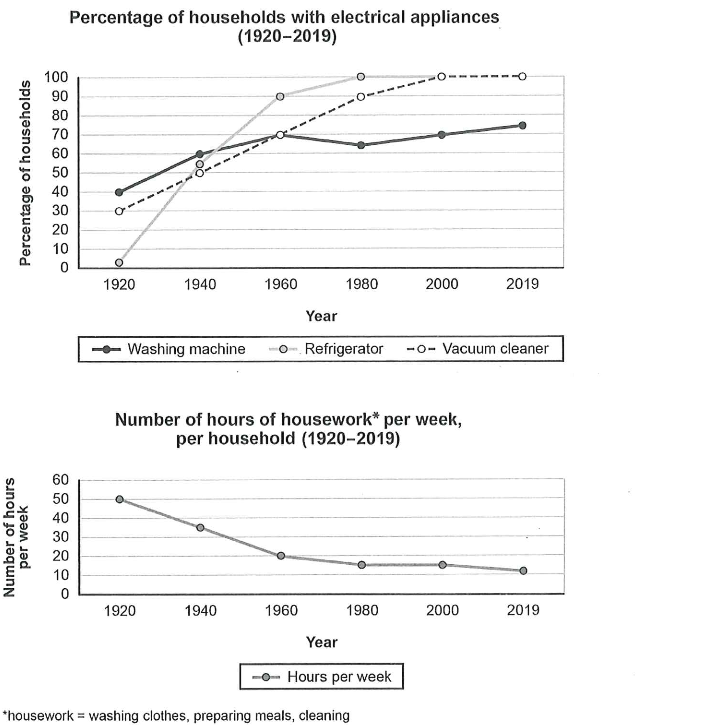
The charts below show the changes in ownership of electrical appliances and amount of time spent doing housework in households in one country between 1920 and 2019.

Summarise the information by selecting and reporting the main features, and make comparisons where relevant.

雅思学术类 Task 1 图表,题目内容:The charts below show the changes in ownership of electrical appliances and amount of time spent doing housework in households in one country between 1920 and 2019。
Cambridge IELTS 16 Academic Writing Test 1 的 Task 1 图表题图片。

Test 2Task 1

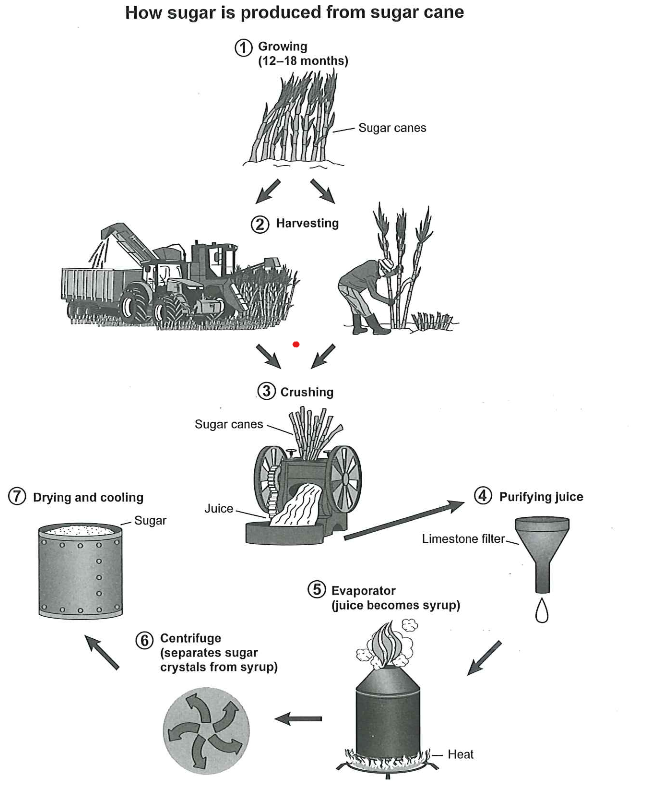
The diagram below shows the manufacturing process for making sugar from sugar cane.

Summarize the information by selecting and reporting the main features, and make comparisons where relevant.

雅思学术类 Task 1 流程图,题目内容:The diagram below shows the manufacturing process for making sugar from sugar cane。
Cambridge IELTS 16 Academic Writing Test 2 的 Task 1 图表题图片。

Test 3Task 1

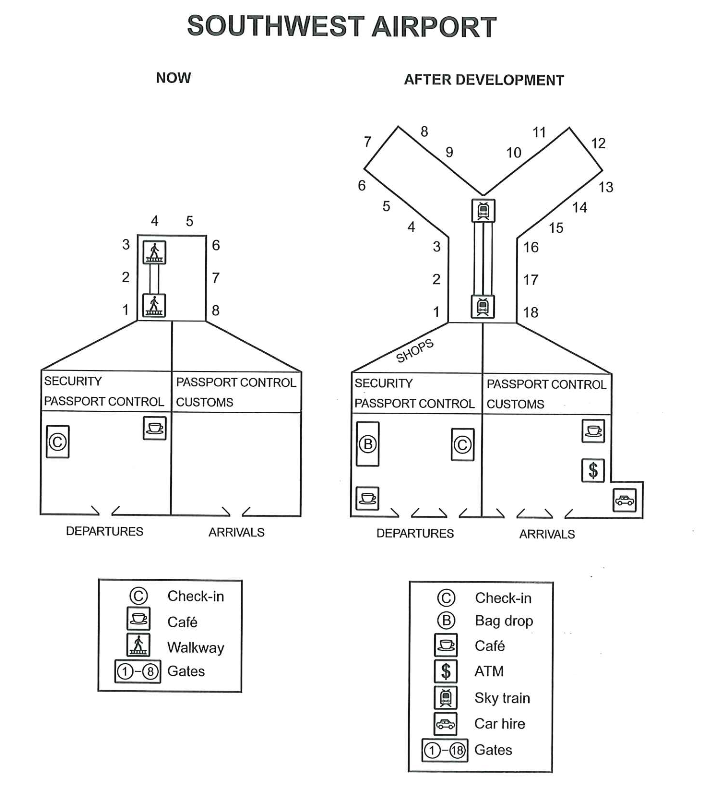
The plans below show the site of an airport now and how it will look after redevelopment next year.

Summarize the information by selecting and reporting the main features, and make comparisons where relevant.

雅思学术类 Task 1 地图,题目内容:The plans below show the site of an airport now and how it will look after redevelopment next year。
Cambridge IELTS 16 Academic Writing Test 3 的 Task 1 图表题图片。

Test 4Task 1

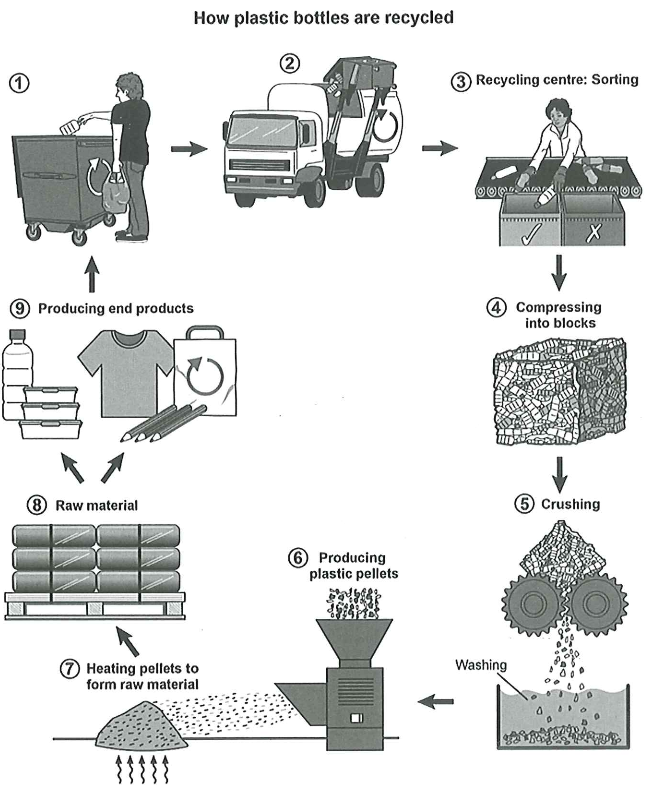
The diagram below shows the process for recycling plastic bottles.

Summarize the information by selecting and reporting the main features, and make comparisons where relevant.

雅思学术类 Task 1 流程图,题目内容:The diagram below shows the process for recycling plastic bottles。
Cambridge IELTS 16 Academic Writing Test 4 的 Task 1 图表题图片。

Cambridge IELTS 15 Academic Writing Task 1 真题

Test 1Task 1

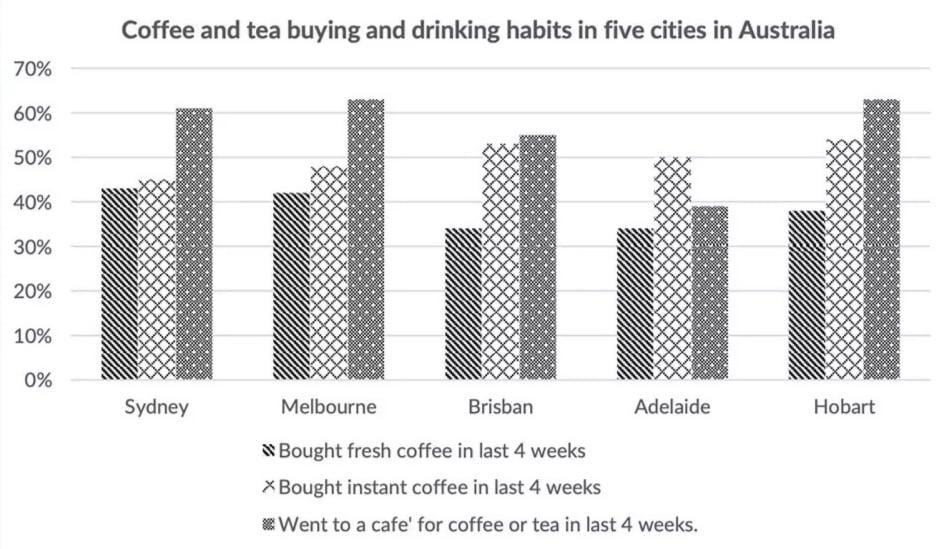
The chart below shows the results of a survey about people’s coffee and tea buying and drinking habits in five Australian cities.

Summarize the information by selecting and reporting the main features, and make comparisons where relevant.

雅思学术类 Task 1 图表,题目内容:The chart below shows the results of a survey about people’s coffee and tea buying and drinking habits in five Australian cities。
Cambridge IELTS 15 Academic Writing Test 1 的 Task 1 图表题图片。

Test 2Task 1

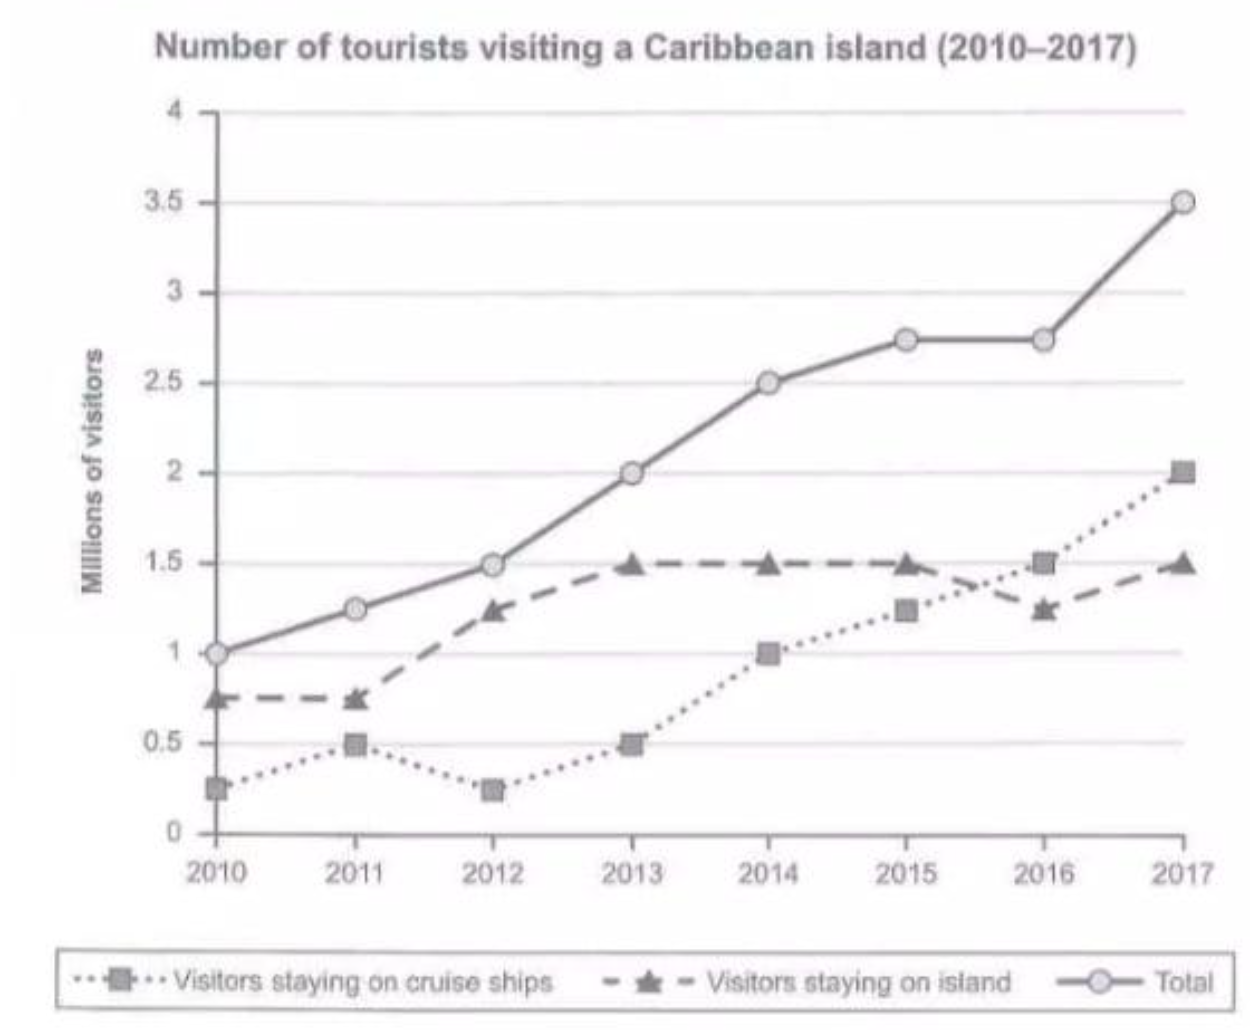
The graph below shows the number of tourists visiting a particular Caribbean island between 2010 and 2017.

Summarize the information by selecting and reporting the main features, and make comparisons where relevant.

雅思学术类 Task 1 图表,题目内容:The graph below shows the number of tourists visiting a particular Caribbean island between 2010 and 2017。
Cambridge IELTS 15 Academic Writing Test 2 的 Task 1 图表题图片。

Test 3Task 1

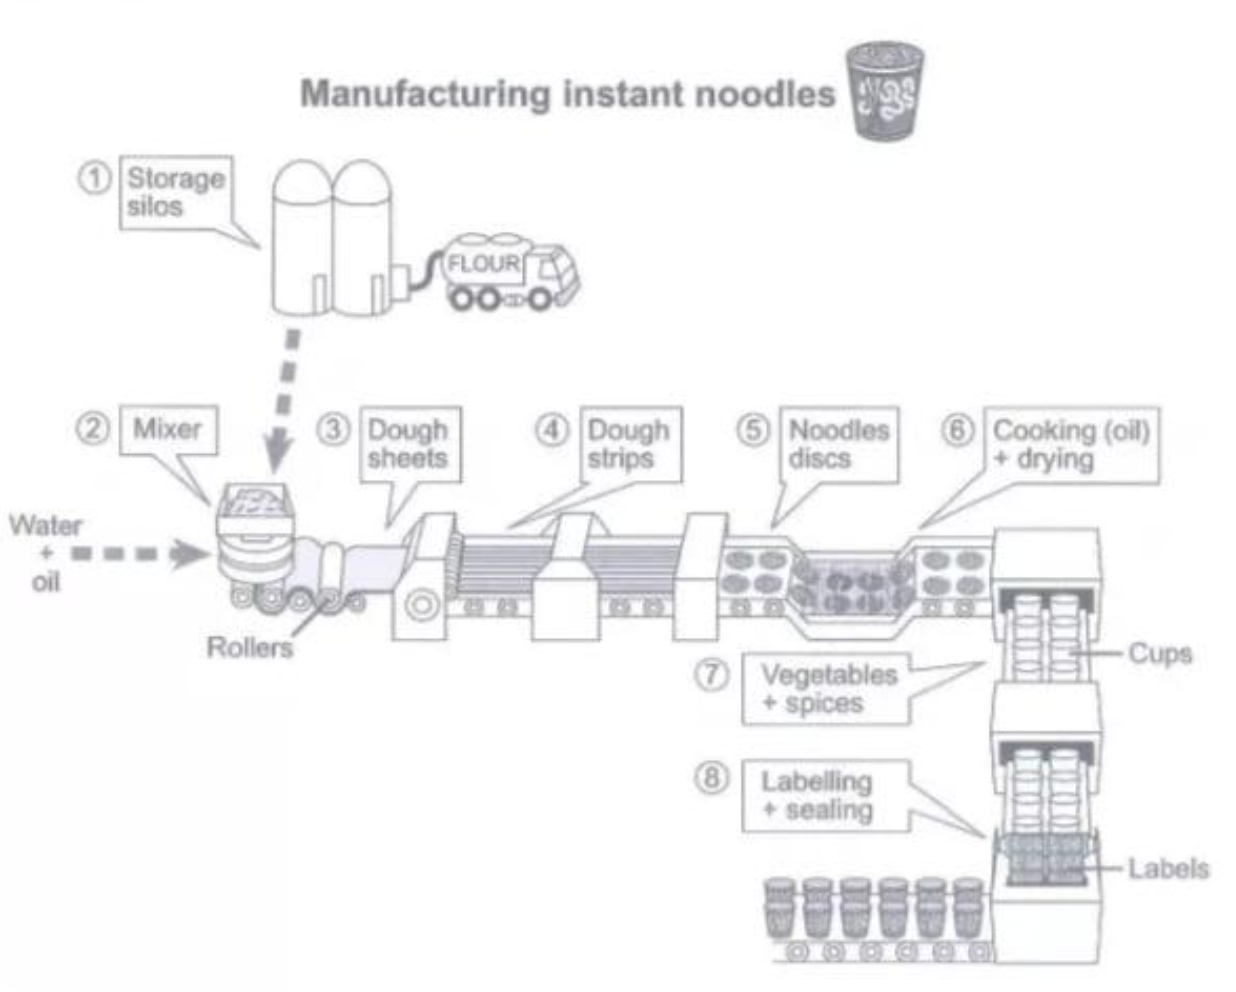
The diagram shows how instant noodles are manufactured.

Summarize the information by selecting and reporting the main features, and make comparisons where relevant.

雅思学术类 Task 1 题目图片,题目内容:The diagram shows how instant noodles are manufactured。
Cambridge IELTS 15 Academic Writing Test 3 的 Task 1 图表题图片。

Test 4Task 1

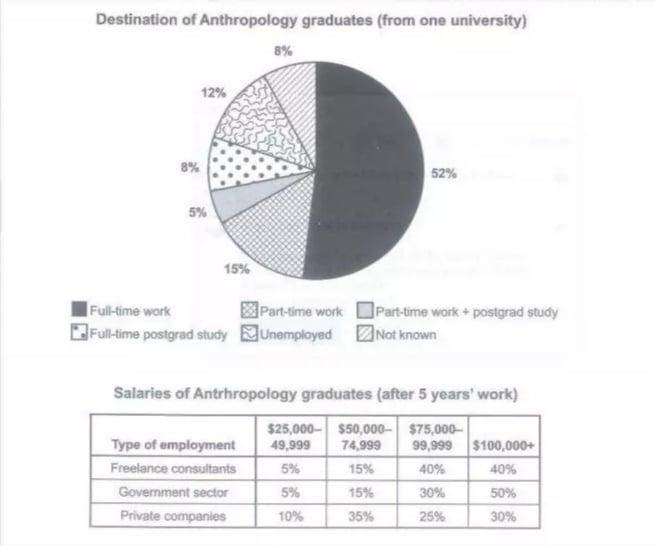
The chart below shows what Anthropology graduates from one university did after finishing their undergraduate degree course. The table shows the salaries of the anthropologists in work after five years.

Summarize the information by selecting and reporting the main features, and make comparisons where relevant.

雅思学术类 Task 1 混合图表,题目内容:The chart below shows what Anthropology graduates from one university did after finishing their undergraduate degree course。
Cambridge IELTS 15 Academic Writing Test 4 的 Task 1 图表题图片。

Cambridge IELTS 14 Academic Writing Task 1 真题

Test 1Task 1

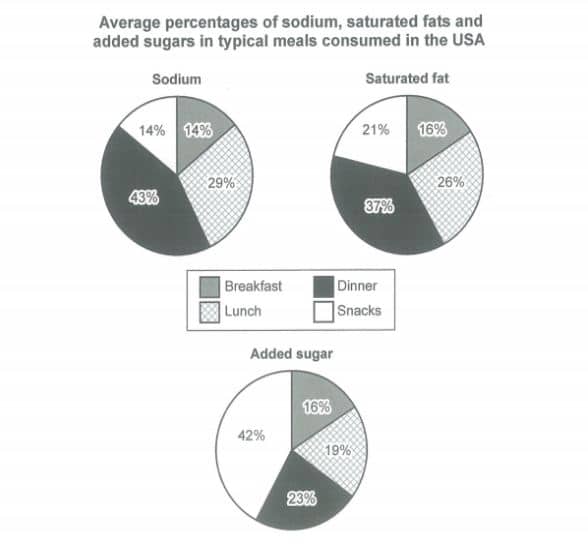
The charts below show the average percentages in typical meals of three types of nutrients, all of which may be unhealthy if eaten too much.

Summarise the information by selecting and reporting the main features, and make comparisons where relevant.

雅思学术类 Task 1 图表,题目内容:The charts below show the average percentages in typical meals of three types of nutrients, all of which may be unhealthy if eaten too much。
Cambridge IELTS 14 Academic Writing Test 1 的 Task 1 图表题图片。

Test 2Task 1

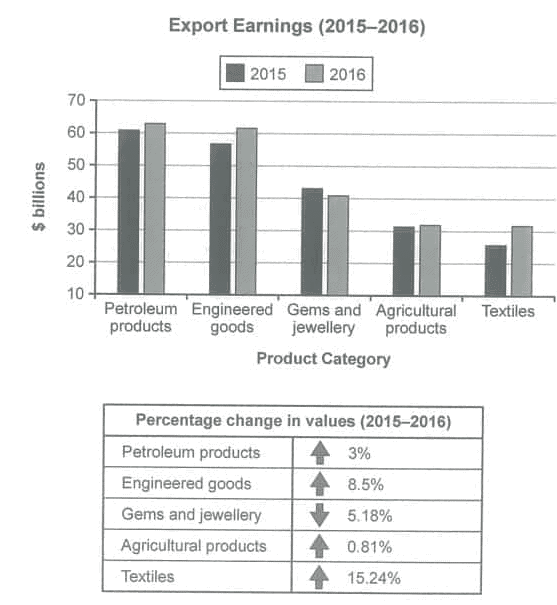
The chart below shows the value of one country’s exports in various categories during 2015 and 2016. The table shows the percentage change in each category of exports in 2016 compared with 2015.

Summarise the information by selecting and reporting the main features and make comparisons where relevant.
雅思学术类 Task 1 混合图表,题目内容:The chart below shows the value of one country’s exports in various categories during 2015 and 2016。
Cambridge IELTS 14 Academic Writing Test 2 的 Task 1 图表题图片。