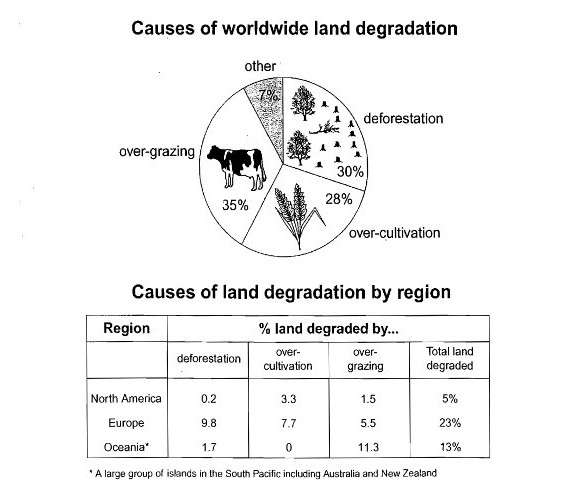
The pie chart below shows the main reasons why agricultural land becomes less productive. The table shows how these causes affected three regions of the world during the 1990s.
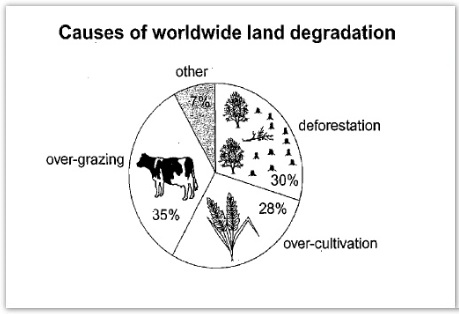
The pie chart below shows the main reasons why agricultural land becomes less productive. The table shows how these causes affected three regions of the world during the 1990s.
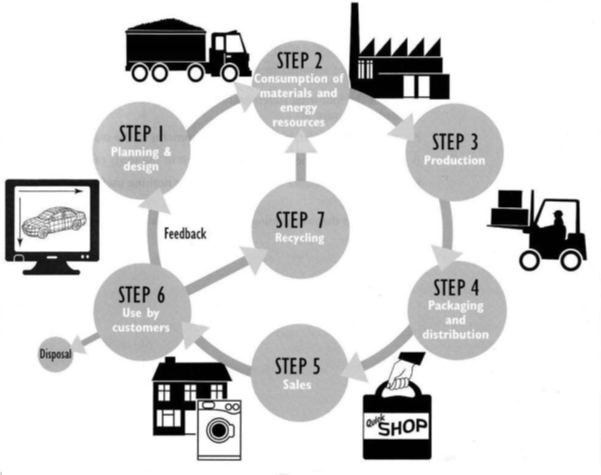
The diagram below shows the environmental issues raised by a product over its lifecycle.
The pie chart below shows the main reasons why agricultural land becomes less productive. The table shows how these causes affected three regions of the world during the 1990s. Summarise the information by selecting and reporting the main features, and make comparisons where relevant.
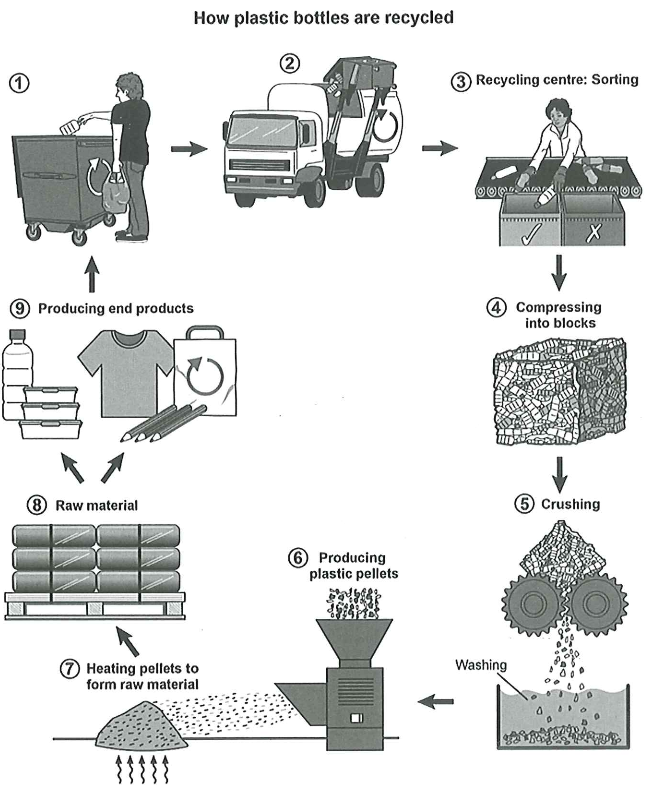
The diagram below shows the process for recycling plastic bottles. Summarize the information by selecting and reporting the main features, and make comparisons where relevant.