IELTS Academic Writing Task 1
雅思柱状图小作文题目
汇总 Cambridge IELTS 和 Official Guide 中的雅思学术类 Task 1 柱状图题目,适合练习数据对比、趋势概述和柱状图小作文结构。
题型 柱状图
题目 15
来源分组 10
用真实 IELTS 题源练习柱状图小作文题目
这些题目集中收录柱状图和类别对比类图表,方便考生练习选择关键数据、写概述句和组织主体段。
Cambridge IELTS Academic 第 18 册
本册共 1 道题。
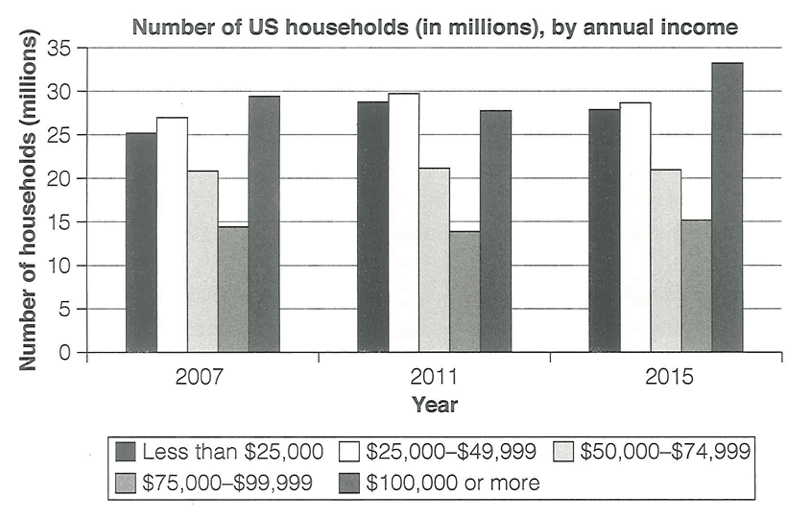
The chart below shows the number of households in the US by their annual ’ income in 2007, 2011 and 2015.
Summarise the information by selecting and reporting the main features, and make comparisons where relevant.
Cambridge IELTS Academic 第 18 册 Writing Test 2 的 Task 1 图片。
Cambridge IELTS Academic 第 17 册
本册共 1 道题。
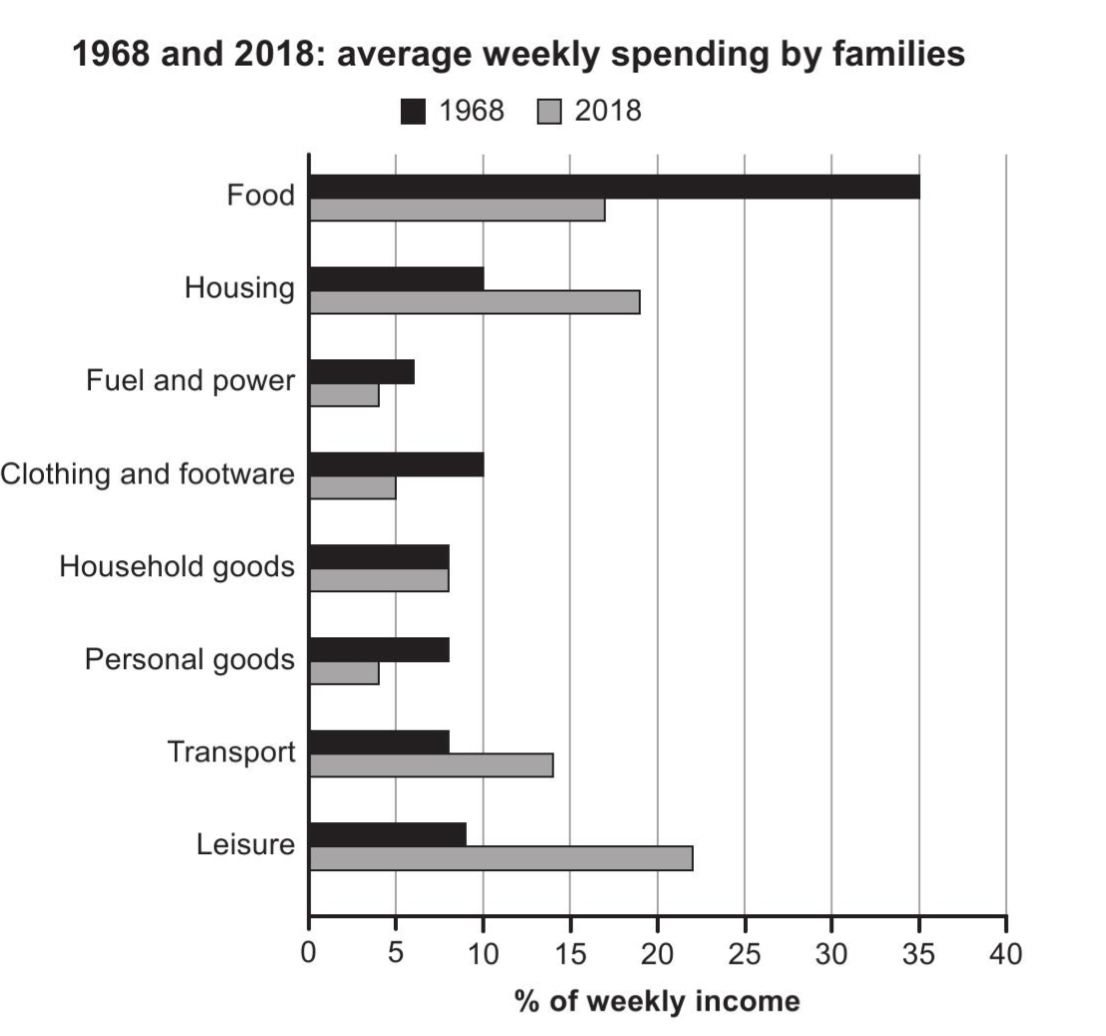
The chart below gives information about how families in one country spent their weekly income in 1968 and in 2018.
Summarise the information by selecting and reporting the main features, and make comparisons where relevant.
Cambridge IELTS Academic 第 17 册 Writing Test 3 的 Task 1 图片。
Cambridge IELTS Academic 第 15 册
本册共 1 道题。
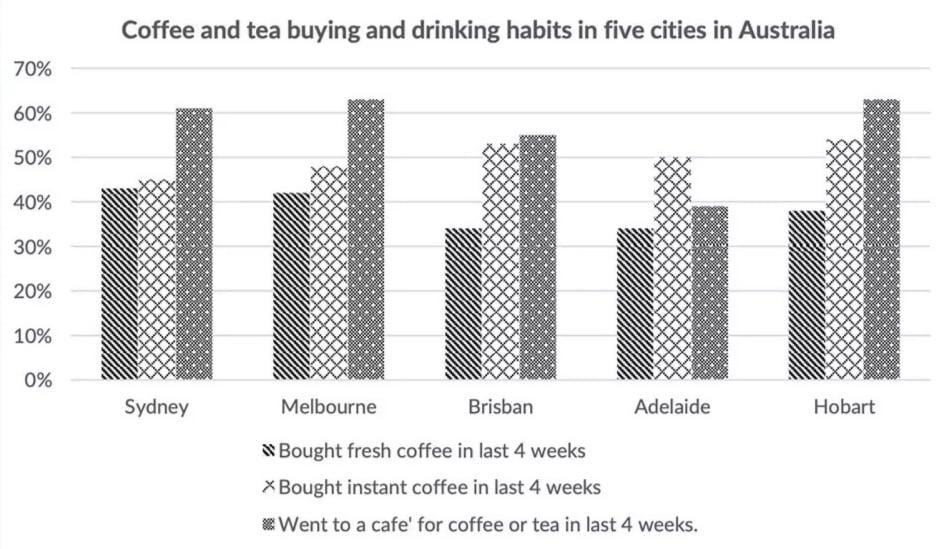
The chart below shows the results of a survey about people’s coffee and tea buying and drinking habits in five Australian cities.
Summarize the information by selecting and reporting the main features, and make comparisons where relevant.
Cambridge IELTS Academic 第 15 册 Writing Test 1 的 Task 1 图片。
Cambridge IELTS Academic 第 14 册
本册共 1 道题。
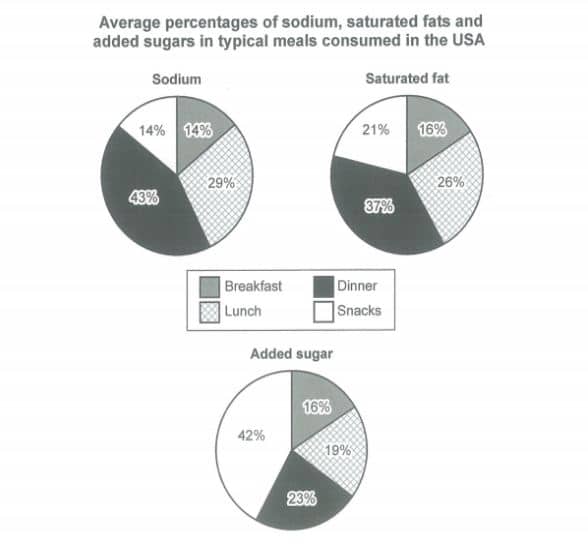
The chart below show the average percentages in typical meals of three types of nutrients, all of which may be unhealthy if eaten too much.
Summarise the information by selecting and reporting the main features and make comparisons where relevant.
Cambridge IELTS Academic 第 14 册 Writing Test 1 的 Task 1 图片。
Cambridge IELTS Academic 第 13 册
本册共 2 道题。
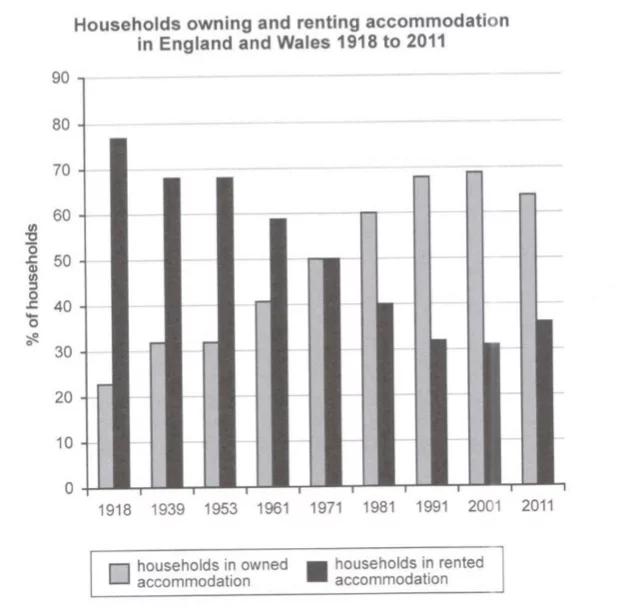
The chart below shows the percentage of households in owned and rented accommodation in England and Wales between 1918 and 2011.
Summarise the information by selecting and reporting the main features and make comparison where relevant.
Cambridge IELTS Academic 第 13 册 Writing Test 2 的 Task 1 图片。
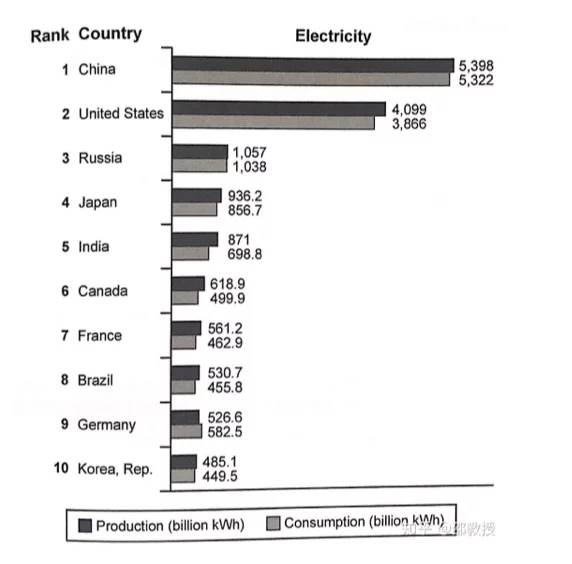
The bar chart below shows the top ten countries for the production and consumption of electricity in 2014.
Summarise the information by selecting and reporting the main features and make comparison where relevant.
Cambridge IELTS Academic 第 13 册 Writing Test 3 的 Task 1 图片。
Cambridge IELTS Academic 第 12 册
本册共 2 道题。
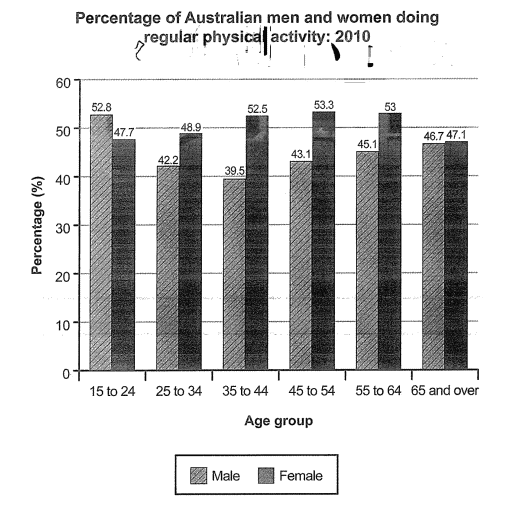
The bar chart below shows the percentage of Australian men and women in different age groups who did regular physical activity in 2010.
Summarise the information by selecting and reporting the main features, and make comparisons where relevant.
Cambridge IELTS Academic 第 12 册 Writing Test 1 的 Task 1 图片。
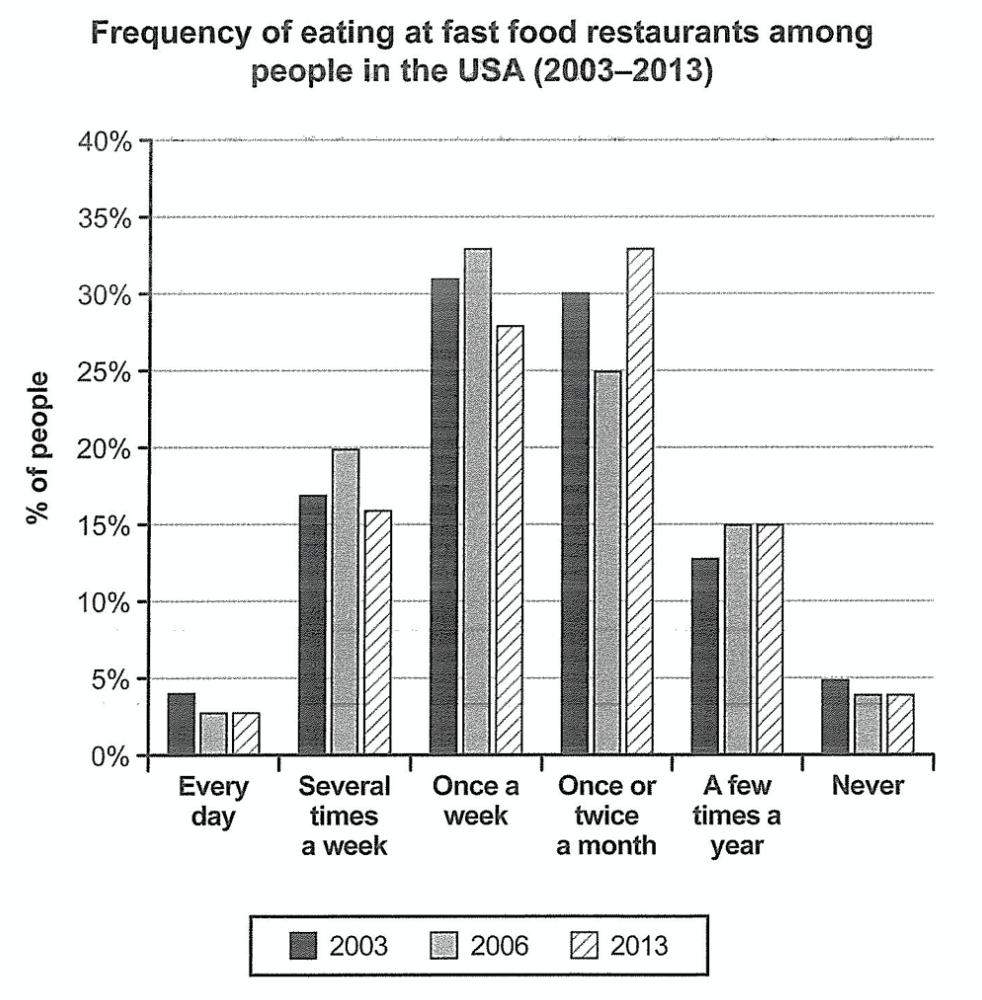
The chart below shows how frequently people in the USA ate in fast food restaurants between 2003 and 2013.
Summarise the information by selecting and reporting the main features, and make comparisons where relevant.
Cambridge IELTS Academic 第 12 册 Writing Test 3 的 Task 1 图片。
Cambridge IELTS Academic 第 9 册
本册共 1 道题。
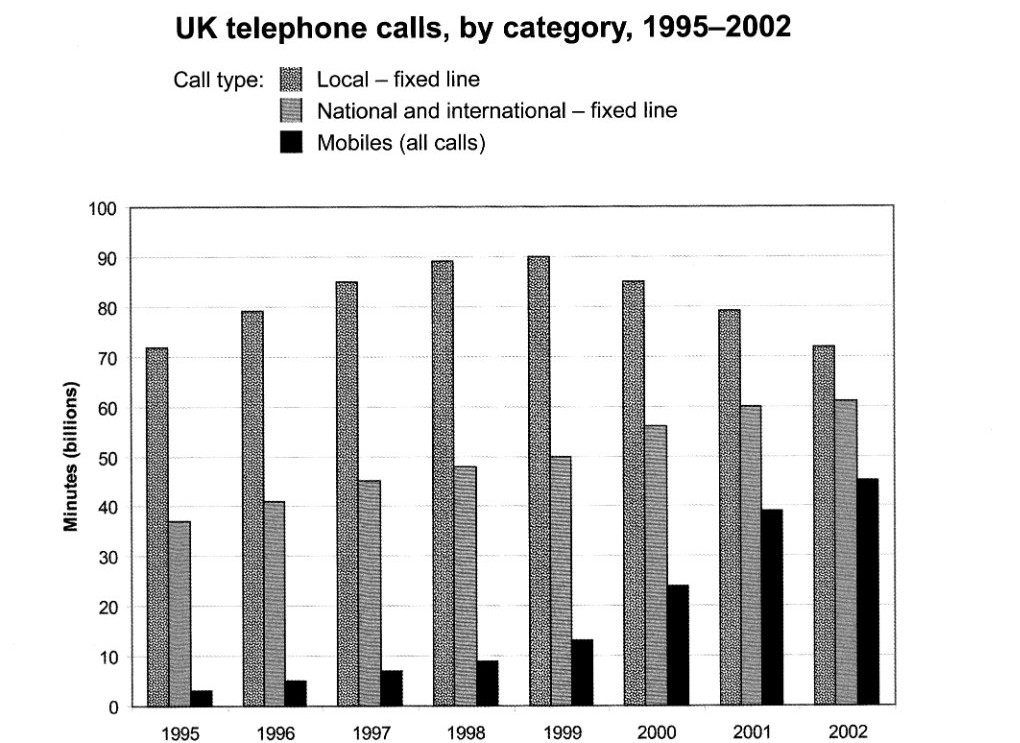
The chart below shows the total number of minutes (in billions) of telephone calls in the UK, divided into three categories, from 1995–2002.
Summarise the information by selecting and reporting the main features, and make comparisons where relevant.
Cambridge IELTS Academic 第 9 册 Writing Test 2 的 Task 1 图片。
Cambridge IELTS Academic 第 7 册
本册共 1 道题。
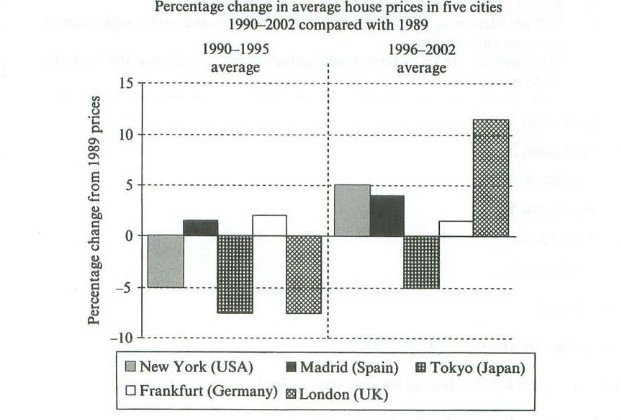
The chart below shows information about changes in average house prices in five different cities between 1990 and 2002 compared with the average house prices in 1989.
Summarise the information by selecting and reporting the main features, and make comparisons where relevant.
Cambridge IELTS Academic 第 7 册 Writing Test 3 的 Task 1 图片。
Cambridge IELTS Academic 第 4 册
本册共 1 道题。
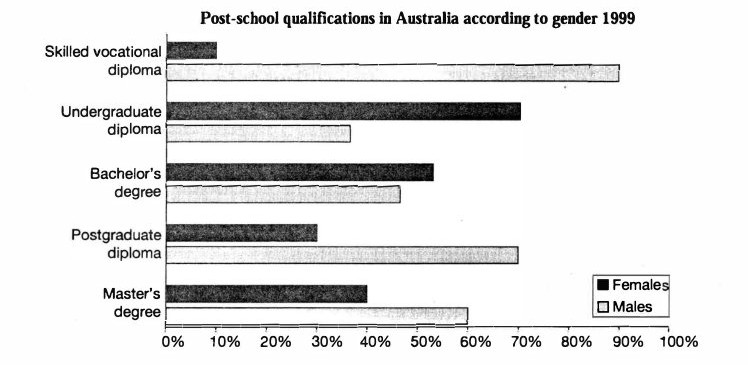
The chart below shows the different levels of post-school qualifications in Australia and the proportion of men and women who held them in 1999.
Summarise the information by selecting and reporting the main features, and make comparisons where relevant.
Cambridge IELTS Academic 第 4 册 Writing Test 3 的 Task 1 图片。
Official Guide to IELTS Academic
本 Official Guide 合集共 4 道题。
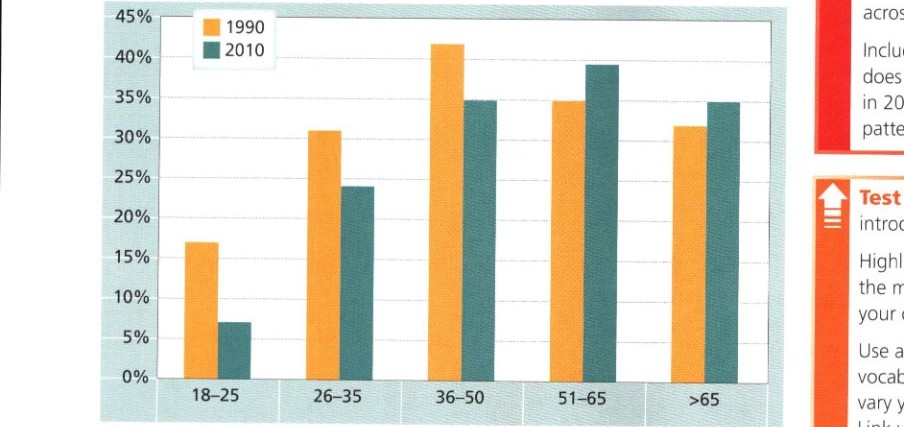
The chart below gives information on the percentage of British people giving money to charity by age range for the years 1990 and 2010.
Summarise the information by selecting and reporting the main features and make comparisons where relevant.
Official Guide to IELTS Academic Writing Test 1 的 Task 1 图片。
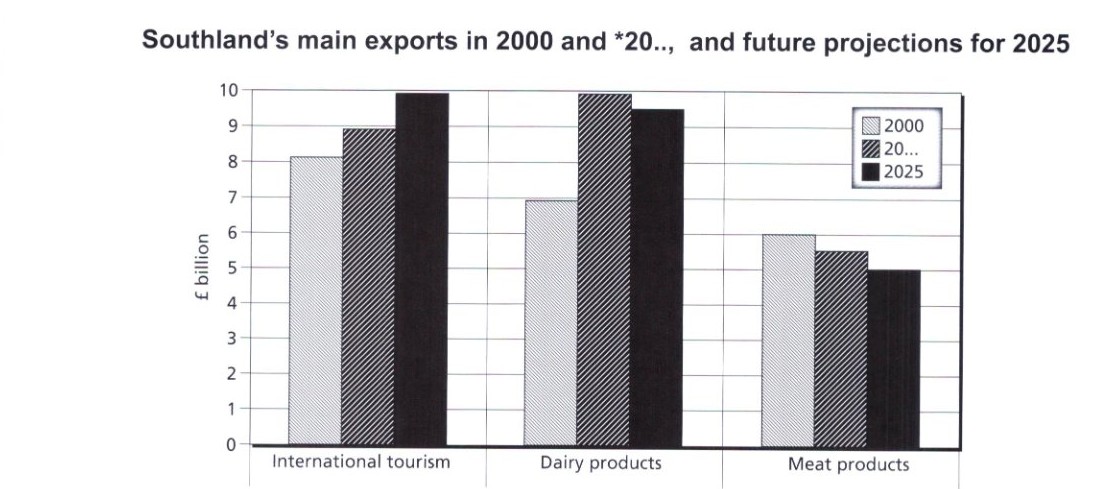
The chart below gives information about Southland's main exports in 2000, 20.., and future projections for 2025.
Summarise the information by selecting and reporting the main features, and make comparisons where relevant.
*20..: for test purposes, use and refer to the current year.
Official Guide to IELTS Academic Writing Test 4 的 Task 1 图片。
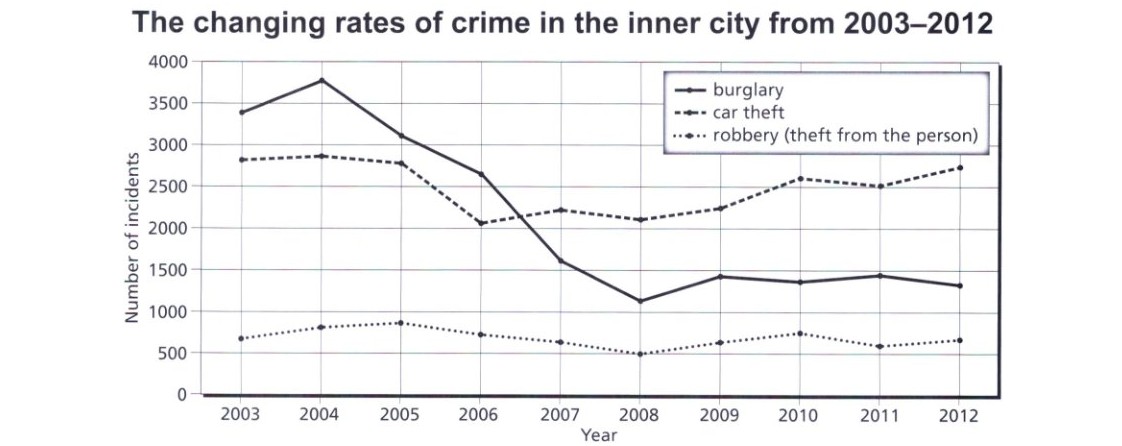
The chart below shows the changes that took place in three different areas of crime in Newport city centre from 2003-2012.
Summarise the information by selecting and reporting the main features, and make comparisons where relevant.
Official Guide to IELTS Academic Writing Test 6 的 Task 1 图片。
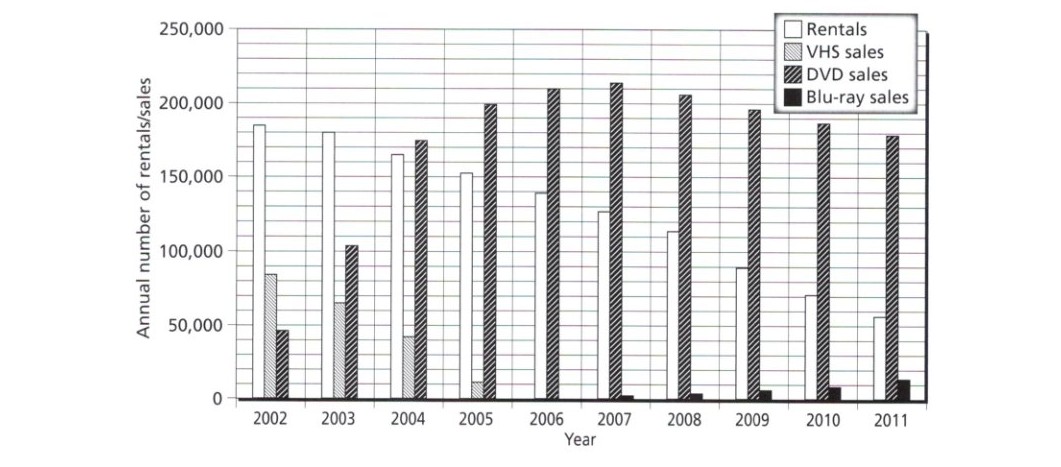
The chart below shows the annual number of rentals and sales, in various formats, of films from a particular store between 2002 and 2011.
Summarise the information by selecting and reporting the main features, and make comparisons where relevant.
Official Guide to IELTS Academic Writing Test 8 的 Task 1 图片。