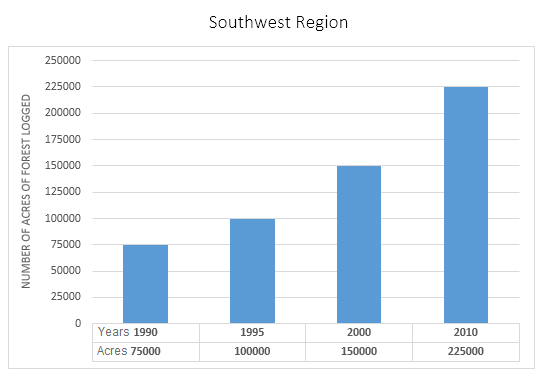
The bar graph below shows the area of forest logged in Southwest region and the table presents the number of forest-dwelling species in the same region.
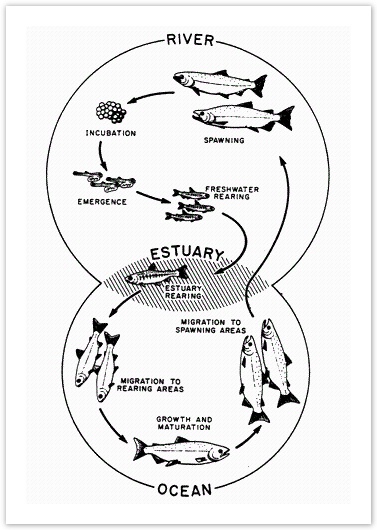
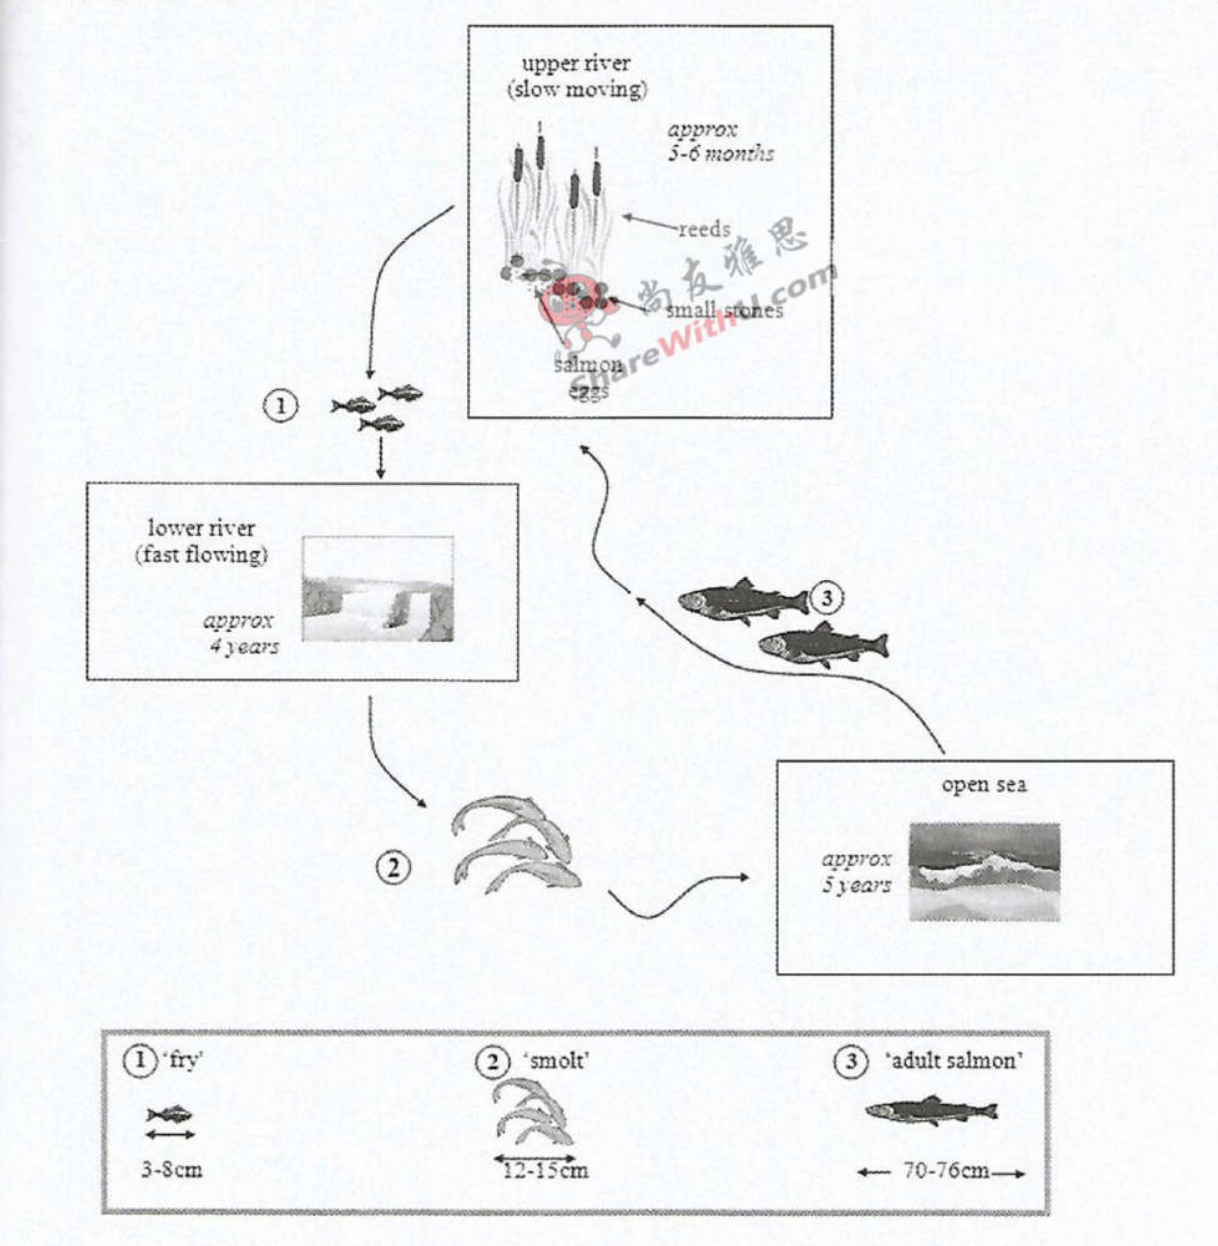
The diagrams below show the life cycle of a species of large fish called the salmon. Summarise the information by selecting and reporting the main features, and make comparisons where relevant.