- 任务完成
- 6.0分
- 连贯与衔接
- 6.0分
- 词汇资源
- 6.0分
- 语法范围与准确性
- 5.5分
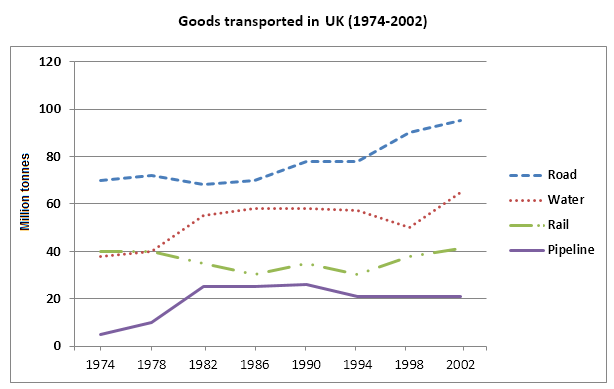
The provided line graph reveals information about the figures for commodities transported in the UK from 1974 until 2002 by using four kinds of transportation. Those transportations were roads, water, rail and pipelines.