IELTS Academic Writing Task 1 Questions: Spending

Question type

Sort

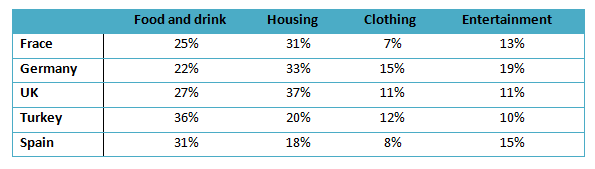
The table illustrates the proportion of monthly household income spend on food and drink, housing, clothing and entertainment in five European countries.

Table for an IELTS Academic Task 1 question about Monthly Household Income Five European Countries.

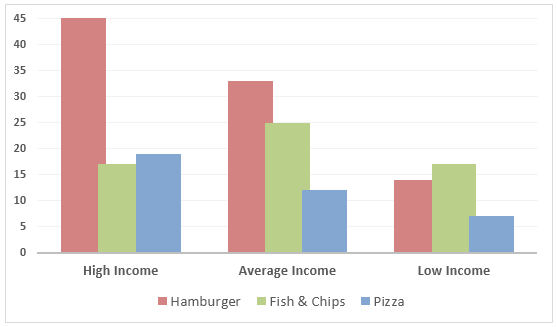
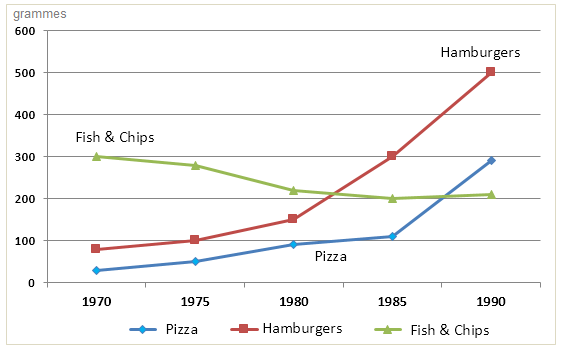
The chart below shows the amount of money per week spent on fast foods in Britain. The graph shows the trends in consumption of fast foods.

Graph 1 of 2 for an IELTS Academic Task 1 question about Graph23 Money Per Week Spent on Fast Food in Britain.
Graph 2 of 2 for an IELTS Academic Task 1 question about Graph23 Consumption Fast Food.

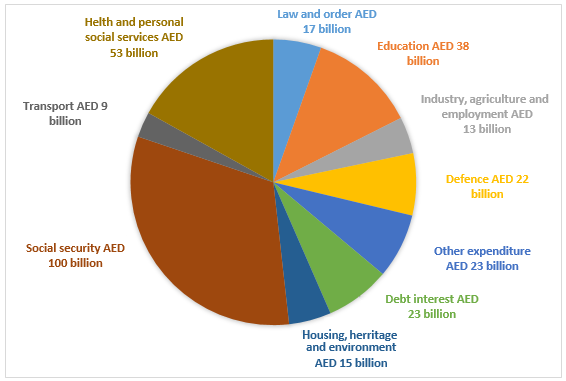
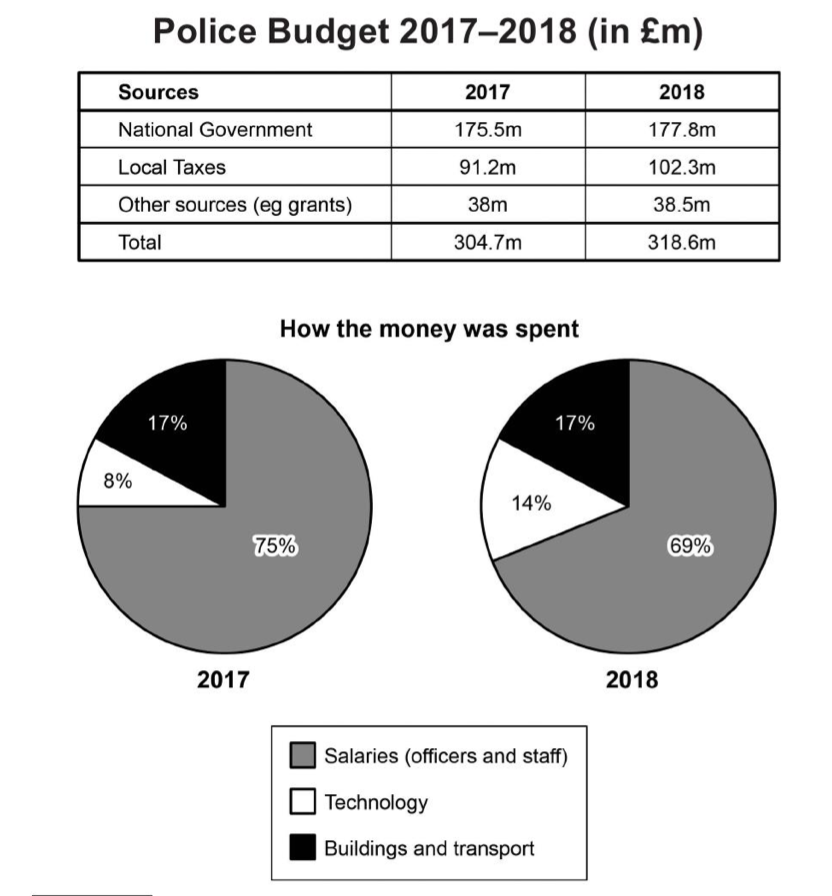
The table and charts below give information on the police budget for 2017 and 2018 in one area of Britain. The table shows where the money came from and the charts show how it was distributed.

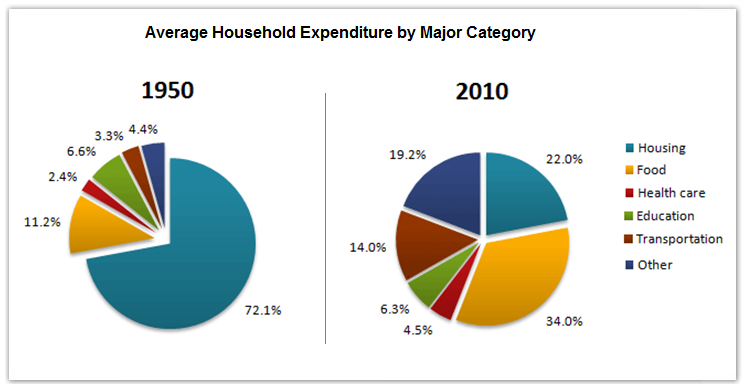
Mixed-chart visual for an IELTS Academic Task 1 question: The table and charts below give information on the police budget for 2017 and 2018 in one area of Britain.

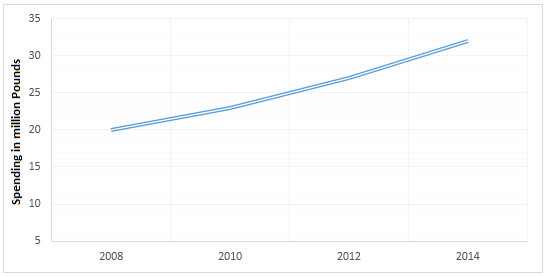
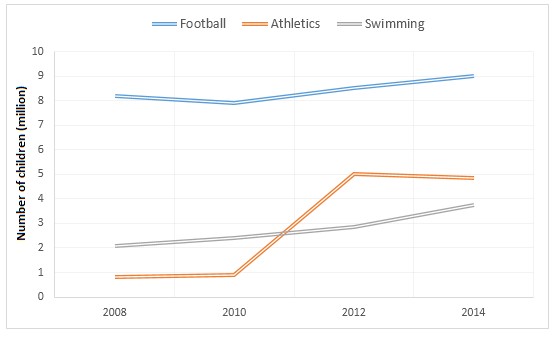
The graphs below show the average monthly expenditure on children’s sports and participation in different sports in the UK from 2008 to 2014.

Graph 1 of 2 for an IELTS Academic Task 1 question about Monthly Spending on Childrens Sports UK.
Graph 2 of 2 for an IELTS Academic Task 1 question about Participation in Three Sports UK.