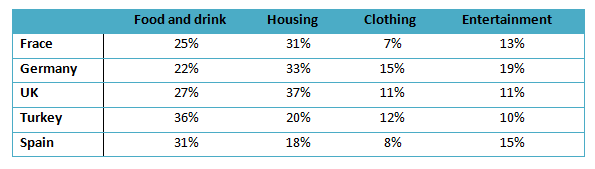
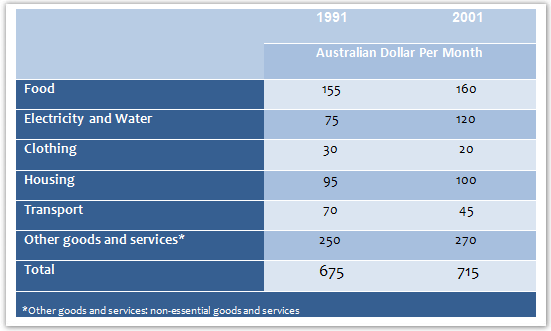
The table illustrates the proportion of monthly household income spend on food and drink, housing, clothing and entertainment in five European countries.
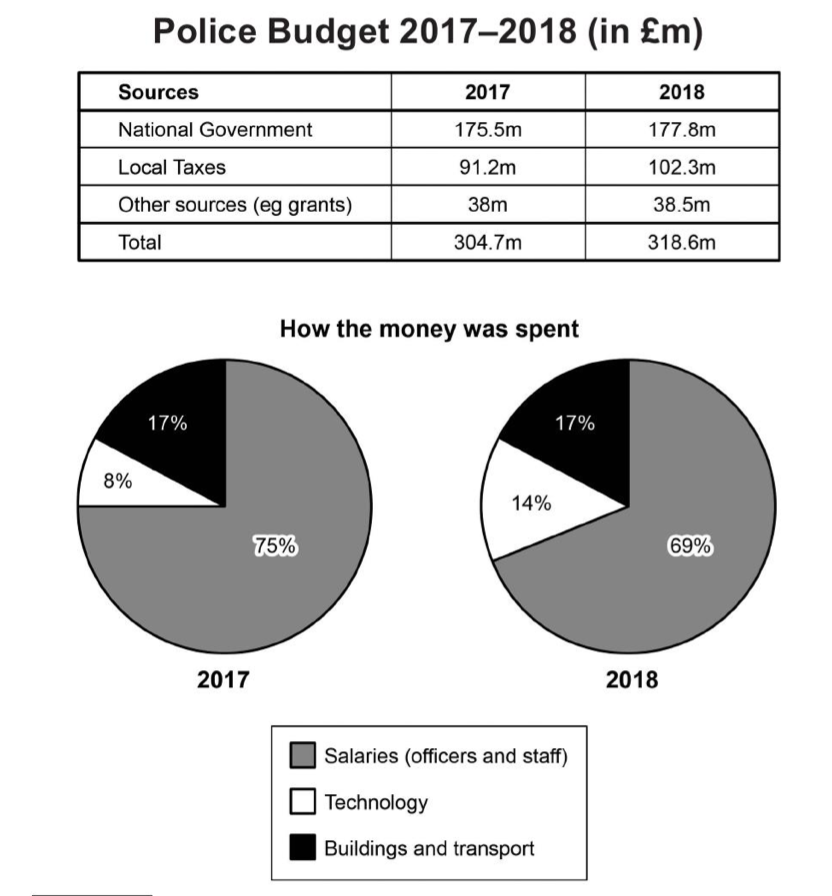
The table and charts below give information on the police budget for 2017 and 2018 in one area of Britain. The table shows where the money came from and the charts show how it was distributed.