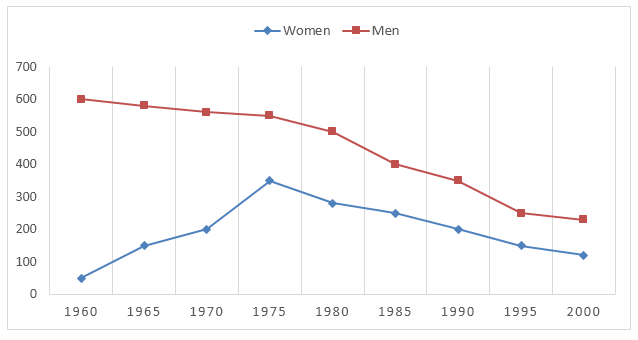
The line graph below gives information about men and women smokers in Bhutan from 1960 to 2000.
2篇作文批改
分数
- 6.0分查看完整批改 →
- 任务完成
- 6.0分
- 连贯与衔接
- 6.0分
- 词汇资源
- 6.0分
- 语法范围与准确性
- 5.5分
The line graph compares the male and female smokers in Bhutan between 1960 and 2000. Overall, the smoking rates among men and women clearly declined over the time and the ratio of male smokers decreased while the opposite was true in the case of female smokers.
- 5.5分查看完整批改 →
- 任务完成
- 5.5分
- 连贯与衔接
- 5.5分
- 词汇资源
- 5.5分
- 语法范围与准确性
- 5.5分
The diagram compares the male and female smokers in Bhutan and shows the smoking trend among the people of Bhutan over a 40 years’ period commencing from 1960. As an overall trend, the percentages of male smokers decreased after 1980 while the ratio of female smokers increased over the given period.