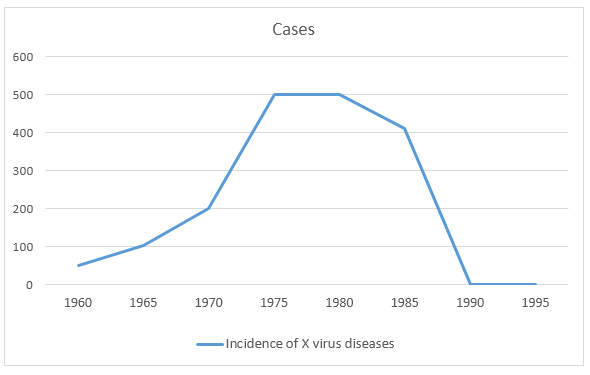
The line graph shows the changes in the number of X virus cases in Australia, throughout 35 years, starting from 1960. Overall, most cases took place between 1975 and 1980 and after 1990, no cases from this virus was reported in Australia.
The line graph gives data on the X virus diseases reported from 1960 to 1995 in Australia. The horizontal line presents years while the vertical line shows the number of reported cases.