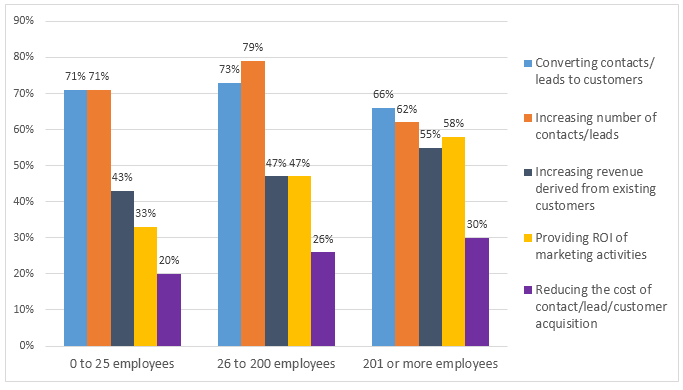
The bar graph shows the priorities set by businesses in the United States in 2016 based on their sizes.
The bar graph outlines the comparative analysis of the American company's top five priorities in 2016 according to the size of the company.