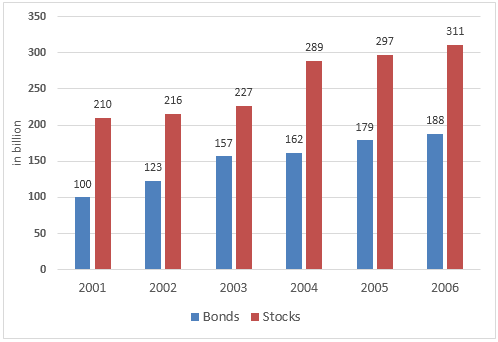
The graph below shows the way people of a country invested their money in stock market during the years 2001-2006. Money invested in stock market in Some country (in billions)
The table below shows personal saving as a percentage of personal income for selected countries in 1970, 1990 and 2010. Canada 5.6 11.5 1.9 France 18.7 12.5 13.6 Germany 13.8 11.8 Italy 29.5 17.6 11.4 Japan 12.1 UK 9.2 8.2 11.1 USA 5.5 4.0