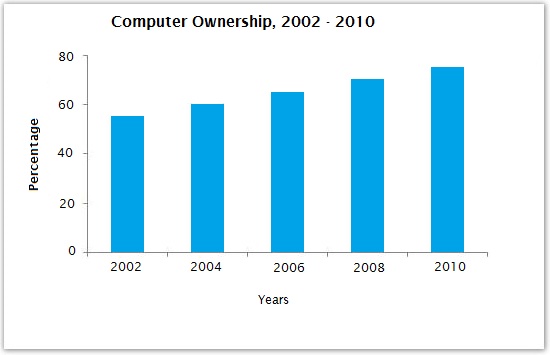
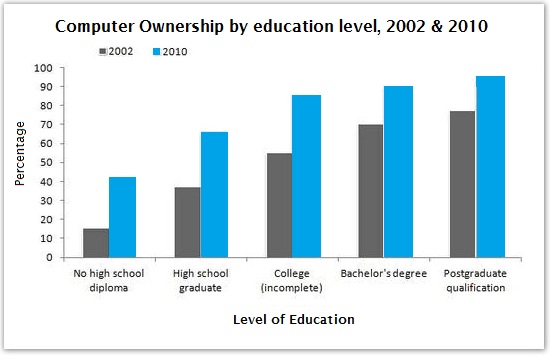
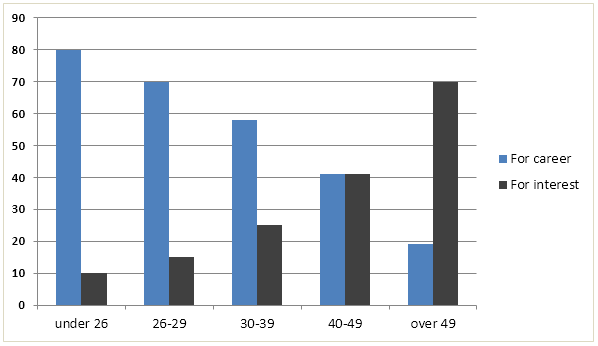
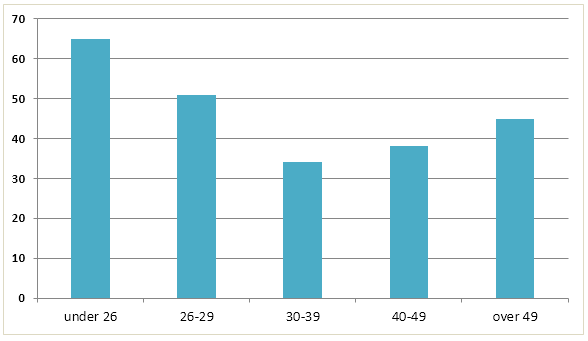
The graphs below give information about computer ownership as a percentage of the population between 2002 and 2010, and by the level of education for the years 2002 and 2010.
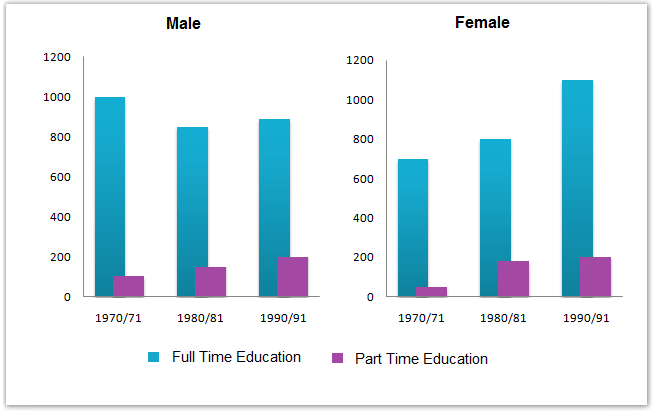
The chart below shows the number of men and women (in thousand) in further education in Britain in three periods and whether they were studying full-time or part-time.