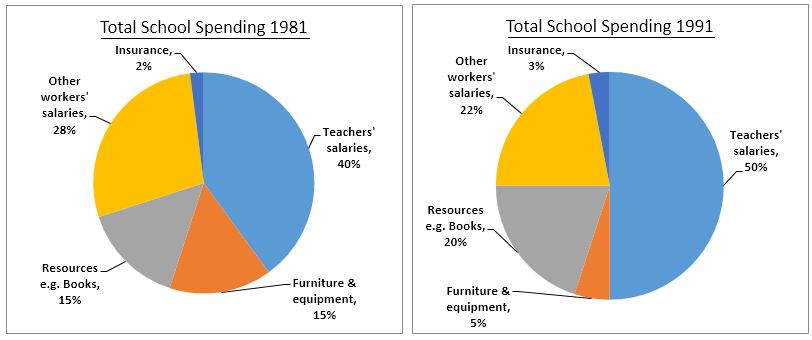
The given pie charts illustrate a UK school's annual spending and show the changes over two decades.
The pie charts depict the shifts in annual expenditure by a certain UK school in three different times, 981, 1991, and 2001. In general, teachers’ salaries were the highest proportion of annual spending percentage.