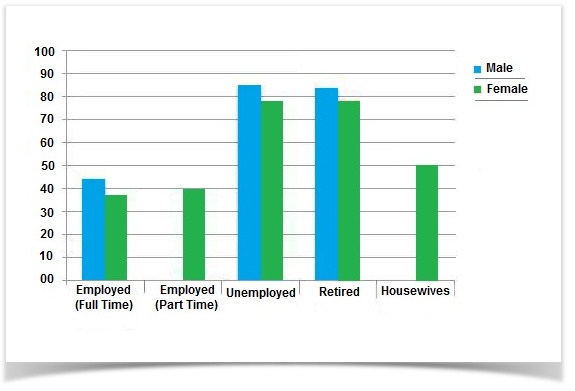
The chart below shows the amount of leisure time enjoyed by men and women of different employment status.

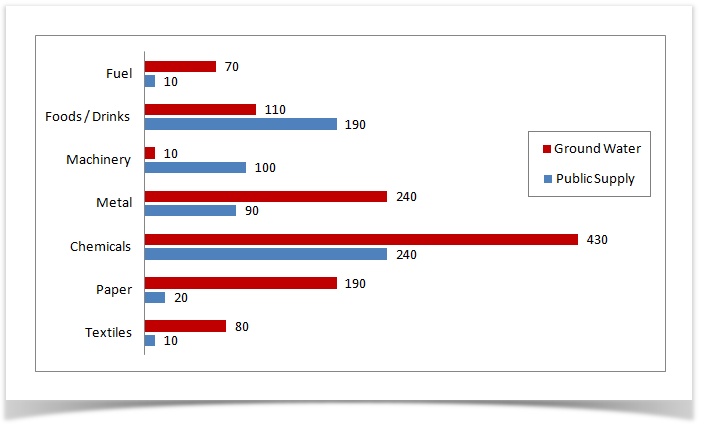
The supplied illustration elucidates the water consumptions in seven different industries breaking down the figures for ground and public supply water. As is obvious, chemical industries use the largest portion of water while water consumption in fuel sector is the lowest.
The provided graph describes the yearly water consumption from ground water and public supply by 7 manufacturers in some country. The unit is measured in millions of cubic meters.
The provided bar graph compares the water consumptions of seven different industries in a year in several countries. These industries use both the ground water and the public supply water and it is evident that the chemical industry requires the highest quantity of water while fuel and textile industries use the lowest quantity of water.