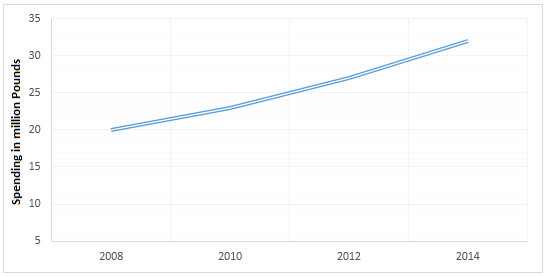
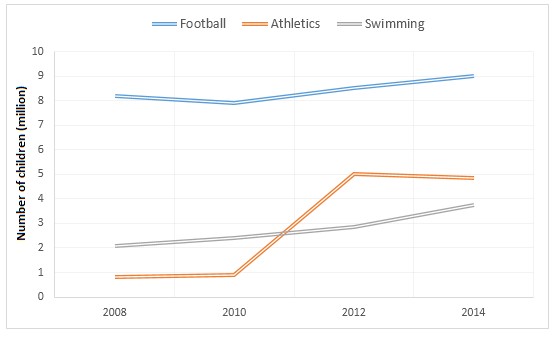
The graphs below show the average monthly expenditure on children’s sports and participation in different sports in the UK from 2008 to 2014.
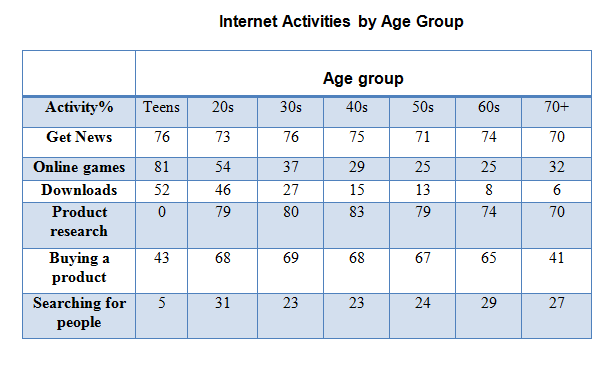
The table below gives information on internet use in six categories by age group.
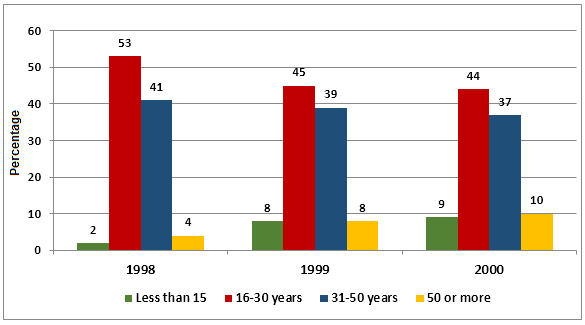
The graph shows Internet Usage in Taiwan by Age Group, 1998-2000.
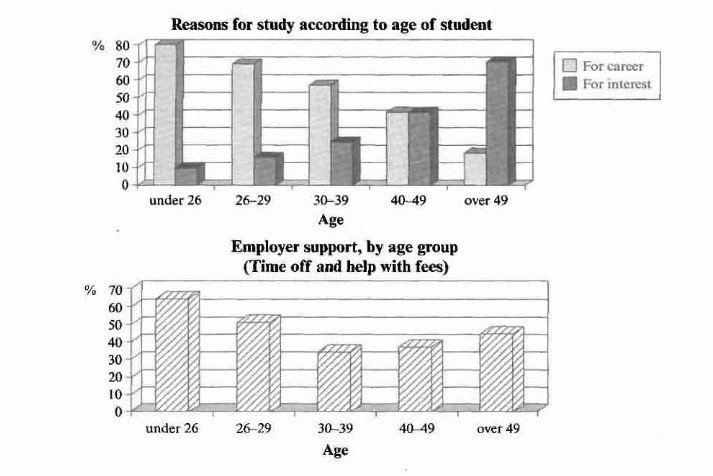
The charts below show the main reasons for study among students of different age groups and the amount of support they received from employers.
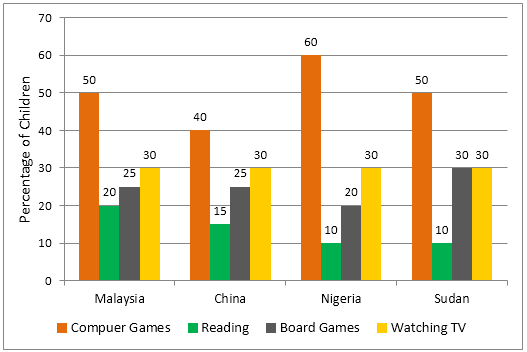
The graph below shows the different home activities among young children in four different countries.
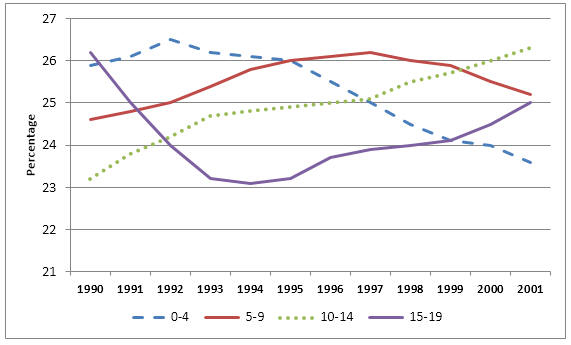
The graph shows children by age group as a percentage of the young population in the United Kingdom between 1990 and 2001.